Two days ago I published an energy budget for the SunVario measured entirely through the device’s own 10 F capacitor: read the bank voltage over BLE, fit a slope, multiply by capacitance. It works, it needs no instruments, and every number in it took hours of wall clock to produce.
Then a second unit landed on the bench with its capacitor not yet soldered on. A board with no bank can’t be measured that way at all — and can be measured the obvious way instead, with a meter in series. So I did both, compared them, and found something at the bottom of every direct reading that had nothing to do with the device.
Why the indirect method existed in the first place
The SunVario has no battery. A 10 F lithium-ion capacitor is the entire power system, and the whole device idles in the low hundreds of microamps. Put a cheap multimeter in series with that and you measure the multimeter’s burden voltage as much as the load; put a proper source meter in series and you own a proper source meter.
The capacitor solves it for free. Charge is Q = C·V, so with a fixed 10 F bank the average current
over any window is just I = C·dV/dt. Read the voltage, wait, read again. The catch is the average
part: to resolve 250 µA you need the bank to move a few millivolts, and at 10 F that is tens of
minutes. A four-mode comparison is a working day. A sweep across twenty operating points is a week.
The other catch is subtler, and it took a second method to see it at all.
The bench, second version
The new unit — FBSV.7C3C, hardware rev 8, running firmware 0.26.0 — has no capacitor on it. It
runs straight off USB: 5.08 V in, through a VRH3601 LDO, 3.6 V to everything downstream. A linear
regulator doesn’t transform current, it dissipates the difference as heat, so the current on its
input is the device’s own current plus the regulator’s quiescent draw. Good enough to compare modes.
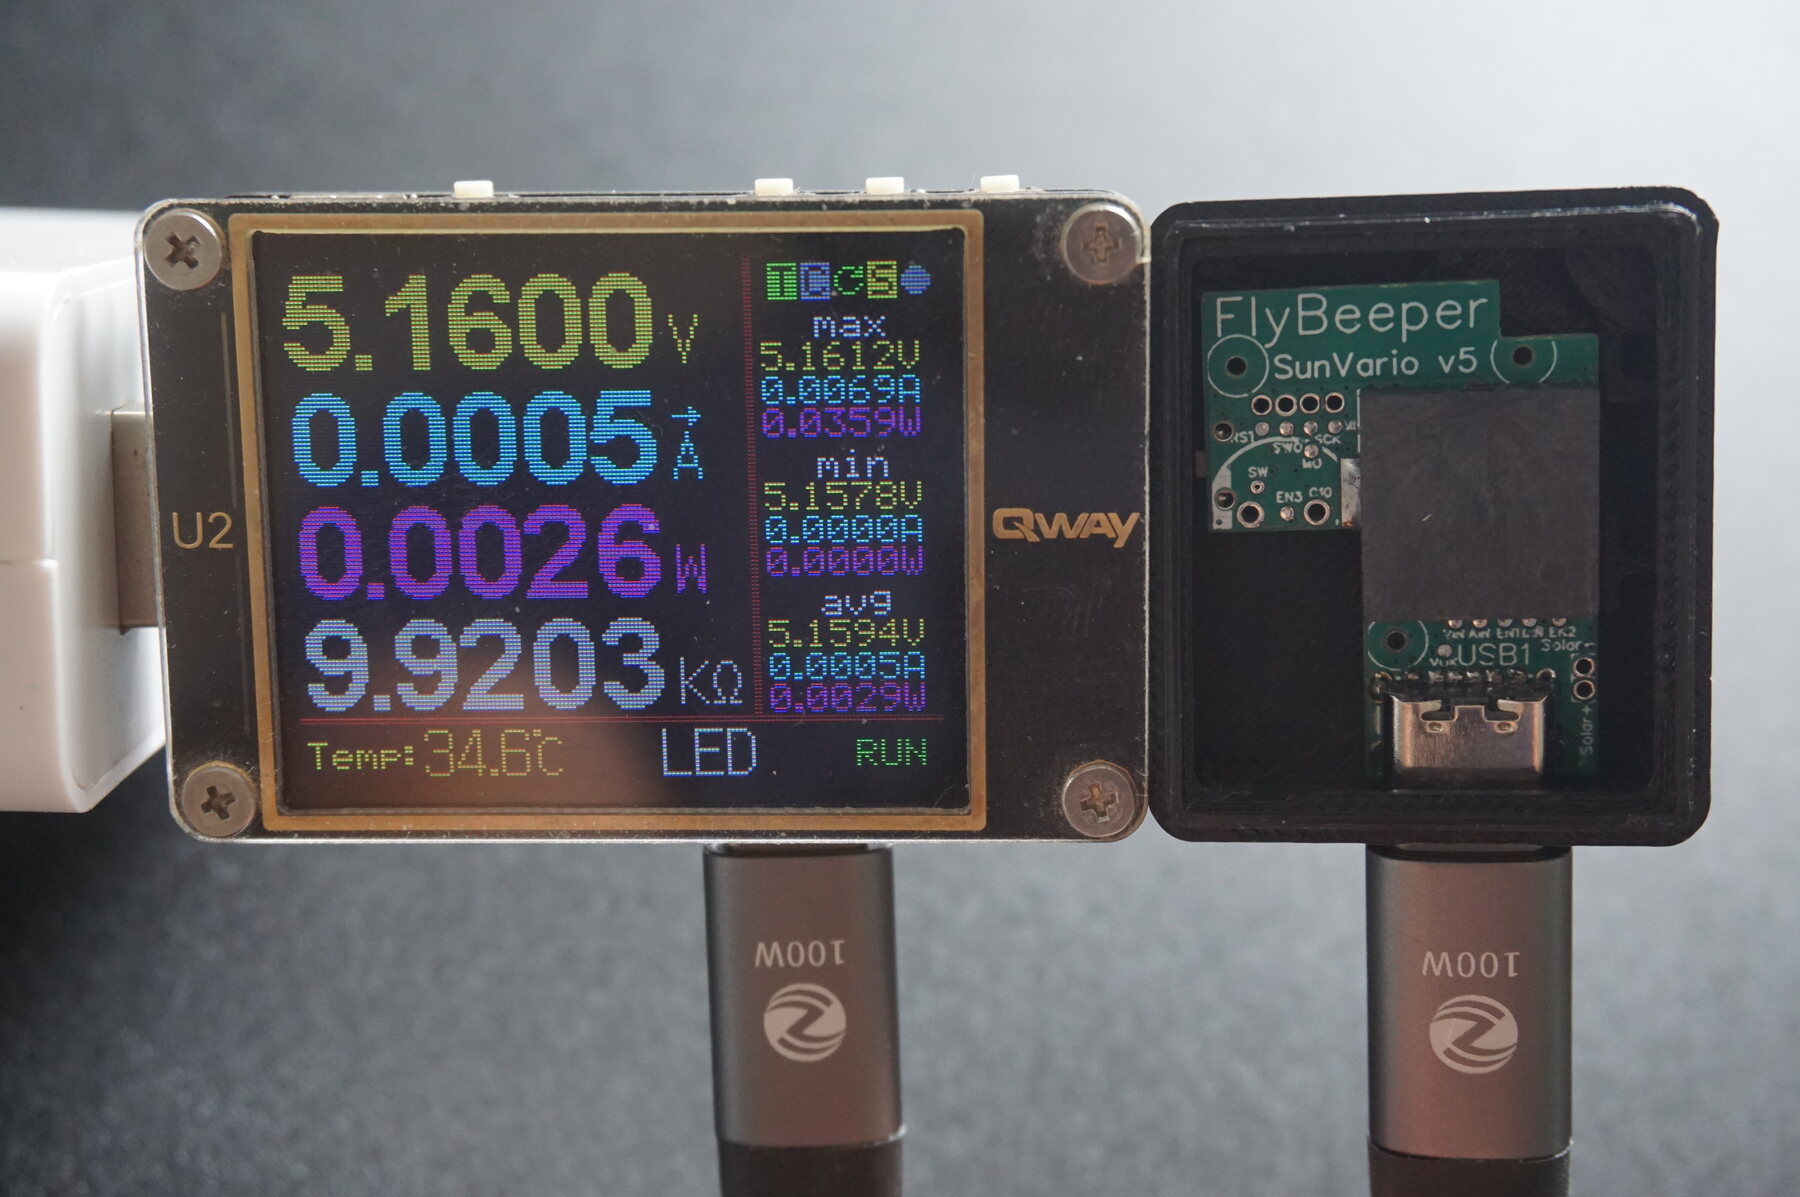
In series sits a WITRN U2, a pocket USB tester with 10 µA resolution. Everything else is a script: BLE writes the vario simulation value and the volume, the tester streams current, each mode gets 6 seconds to settle and 20 seconds of averaging — about 500 samples per point. Twenty-seven operating points took twelve minutes, including two dropped BLE connections and their reconnects.
The wiring is worth a sentence, because the tester works through two connectors at once. Its Type-A plug goes into an ordinary phone charger, and the board under test hangs off the tester’s output — that is the path whose current is being measured. The readings leave by a separate micro-USB socket on the side of the tester, over a cable to the computer, and it is that second connector that delivers the ~25 samples a second to the logger. The two paths are physically distinct, which is also why the logging never shows up in the numbers: the computer sits on its own connector, not in series with the device.
That is the headline, really. Not the numbers below, but the ratio: twelve minutes against a week, because with a direct meter the measurement window is set by how fast the load settles, not by how fast a 10 F capacitor drifts.
Reading the tester from Linux
The U2 enumerates as a plain HID device (0716:5030) and needs no vendor driver — it just doesn’t
stream until you poke it. The protocol was reverse engineered by the CuVoodoo project; the part you
need is a 64-byte trigger with two checksums, repeated a few times a second:
t = bytearray(64)
t[0:2] = b"\xff\x55"
t[8], t[9], t[10] = 0x1a, 0x01, 0x0a
t[62] = sum(t[8:62]) & 0xFF        # payload checksum
t[63] = sum(t[0:62]) & 0xFF        # frame checksum
os.write(fd, b"\x00" + bytes(t))   # leading 0 = HID report id
Each reply is 64 bytes with little-endian floats: voltage and current at offset 10, temperature at
offset 38. Open /dev/hidraw*, match the vendor and product in device/uevent, select() on it,
and you have ~25 samples per second of volts, amps and case temperature in a CSV. No GUI, no Windows
tool, no vendor SDK.
The 420 µA that were never mine
The first direct reading was the device idle, advertising, sound off: 568 µA. The indirect method had put the same broad state at well under 100 µA. Factor of six. One of the two was lying.
The cheapest possible check is to remove the device from its own measurement. I asked for the unit to be switched off at the button, USB still plugged in, and watched the tester:
device ON,  advertising, sound off : 0.568 mA
device OFF (System OFF, button)    : 0.420 mA
Nothing moved. Not “roughly the same” — 630 consecutive samples, minimum equal to maximum, dead flat 0.420 mA with the microcontroller in System OFF. Three quarters of every reading I had just taken belonged to something other than the device.
So I swapped the cable. The whole series above was taken through a 100 W USB-C cable; I repeated the switched-off reading through an A-to-C cable from a GoPro, device still off, nothing else touched:
100 W USB-C cable,  device OFF : 0.420 mA
GoPro A-to-C cable, device OFF : 0.620 mA
Two hundred microamps of difference, from changing a cable, with the device asleep. That settles the question of ownership: the floor is not the device’s, it’s the harness’s, and it is not even a fixed property of the bench.
The mechanism is the Type-C configuration channel. A device-side port pulls CC1 and CC2 down through 5.1 kΩ, and the source end advertises how much current it can supply with a pull-up on the same line — 56 kΩ, 22 kΩ or 10 kΩ, depending on what the cable or charger claims. In an A-to-C cable that pull-up sits between VBUS and CC, so the resulting divider current comes straight out of VBUS and runs through the tester’s shunt. Different cable, different pull-up, different floor. The residue on top of that is the LDO’s own quiescent draw, and I can’t separate the two without putting a meter directly on CC.
You can’t fix this by finding a cable with no CC line, either — that’s what a Type-C port is. The fix is procedural, not physical: measure the floor on the exact harness you’re about to use, and subtract it.
Which is the whole methodological point of this article:
A series meter measures everything between its terminals. Before you attribute a single microamp to your firmware, turn the device off and see what’s left. Whatever remains is your floor, it belongs to your bench and not to your design, and it has to come off every number you report.
Every figure from here on has 420 µA subtracted — the floor of the 100 W cable the whole series was taken on.
Where the current actually goes
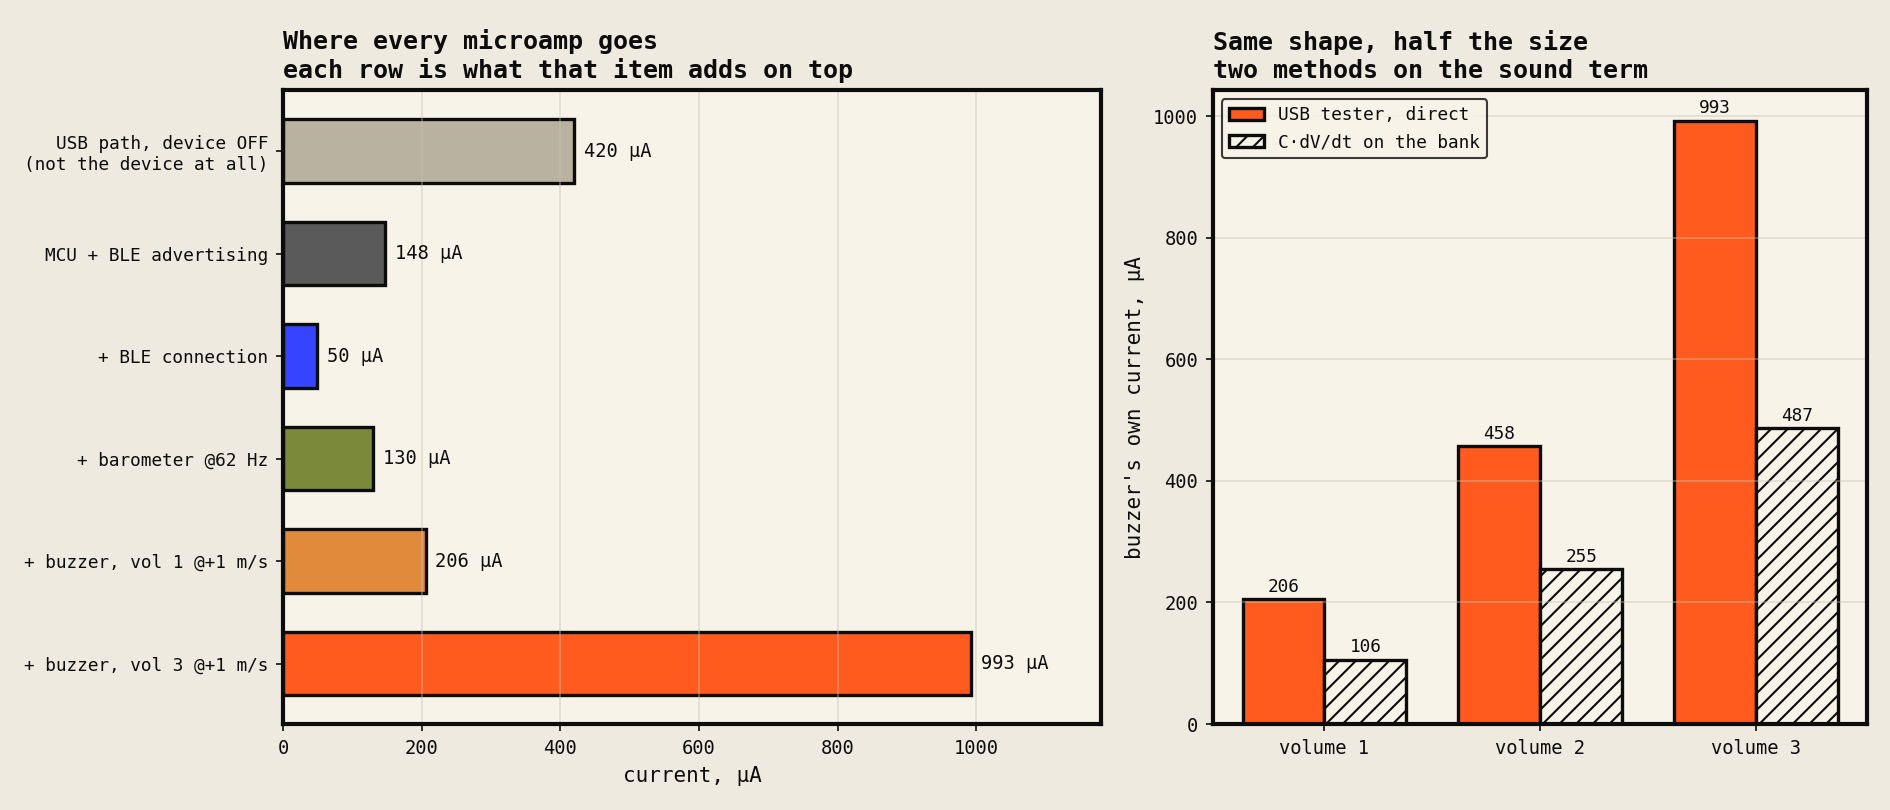
With the floor removed, climbing at +1 m/s with a phone connected and subscribed:
| Item | Adds | Running total |
|---|---|---|
| MCU + BLE advertising, everything else stopped | 148 µA | 148 µA |
| a live BLE connection, no subscriptions | +50 µA | 197 µA |
| barometer polling at 62 Hz | +130 µA | 327 µA |
| buzzer, volume 1, climbing +1 m/s | +206 µA | 533 µA |
| buzzer, volume 2, same climb | +458 µA | 785 µA |
| buzzer, volume 3, same climb | +993 µA | 1320 µA |
Two things in that table are worth dwelling on.
The barometer only runs when someone is listening — and “listening” includes the buzzer. A
connection on its own costs 50 µA, because with volume at zero and nobody subscribed, the pressure
timer in ess.c never starts. Raise the volume and the sensor comes up with it, through the same
ess_sync_with_volume() shim I added after the first round of measurements. That is why a silent
device with volume 1 selected costs 128 µA more than a silent device with volume 0: it isn’t the
audio path idling, it is the SPL07-003 being polled every 16 ms so the vario has something to say.
The two methods agree on that sensor. The discharge logs put the barometer at 141 µA; the tester says 130 µA. Two completely different instruments, different unit, different power source, 8 % apart. When an independent method lands that close on a shared term, both methods are basically sound — which makes the place where they don’t agree much more interesting.
The full curve, which the indirect method could never have produced
Twelve minutes buys you resolution that hours per point can’t. Here is the device’s current against simulated vertical speed, at the quietest and loudest volume settings:
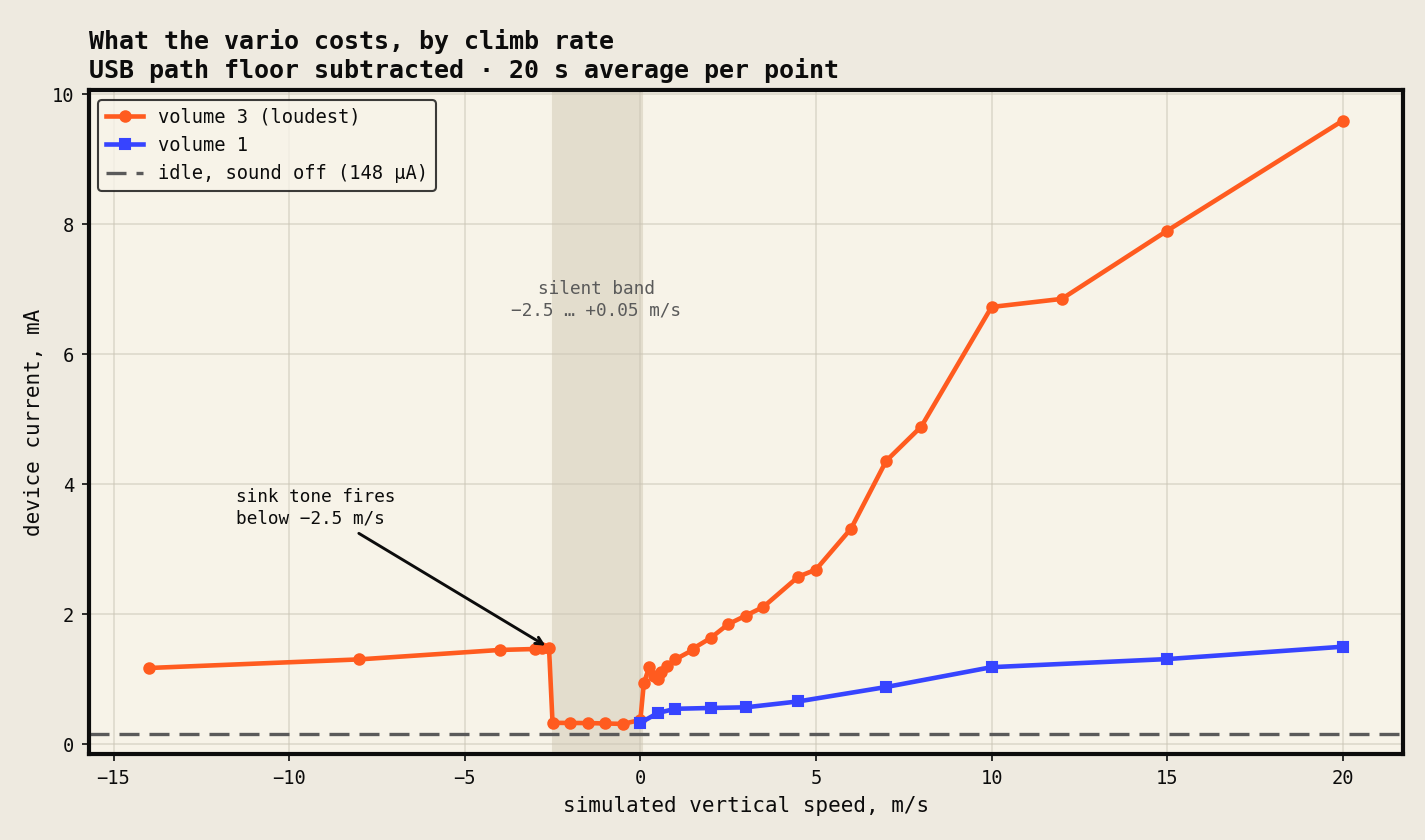
The shape is entirely a consequence of the tone tables in firmware. The vario interpolates frequency, cycle time and duty across twelve breakpoints:
vario, cm/s :  -1400  -800  -100    0   39   40  100   200   300   450  1200  2000
frequency,Hz:    200   250   390  395  400  470  760  1120  1480  2020  4720  6000
cycle,     ms:   850   790   725  350  150  595  430   325   265   210   120   100
duty,       %:   100    98    95   20   80   41   43    46    49    54    78    90
Read the curve against that table and everything lines up:
- Consumption rises monotonically with climb rate. No peak in the middle, no roll-off at the top: 9.6 mA at +20 m/s, which is 65× the idle draw. Both terms push the same way — the tone climbs from 400 Hz to 6 kHz and the duty cycle goes from 43 % to 90 %, so at the top the device is almost continuously singing at the most expensive pitch it knows.
- There is a silent band from −2.5 to +0.05 m/s where the device costs whatever the barometer and the radio cost, and nothing more. In real flight that band is where you spend most of a glide.
- The sink tone fires below −2.5 m/s and the transition is a cliff, not a ramp: −2.50 m/s is
silent, −2.60 m/s draws 1.5 mA. That is
BUZZER_SINK_TONE_ON_THRESHOLD = -250cm/s doing exactly what it says. Deep sink then gets slightly cheaper as the tone drops toward 200 Hz.
Which brings up the second curve: what the piezo itself costs, normalised so that duty cycle is out of the picture.
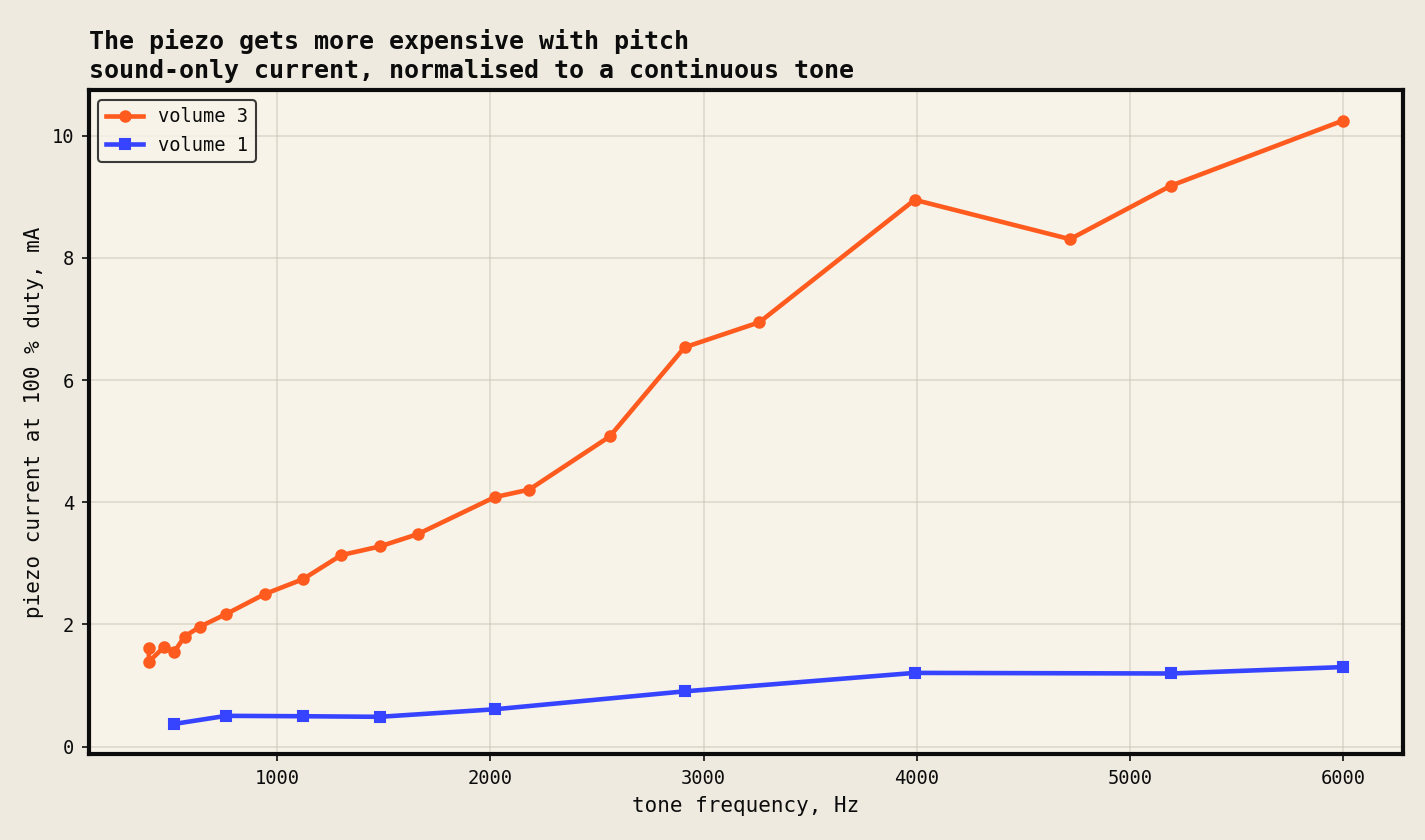
A piezo is a capacitive load, so a first-order model says current scales with frequency — and across 500 Hz to 6 kHz, a 12× span, the loud trace grows about 6×. Sub-linear, with a visible kink around 4 kHz where the element is nearest resonance and its impedance stops behaving. The quiet trace grows only about 3.5×, because at volume 1 the charge pump is passing the supply through nearly unmodified and a bigger share of the current is fixed overhead.
The practical reading: pitch is not free. Two vario tunings that beep for the same fraction of the time can differ by 3× in what the sound costs, purely in the frequency table. If you ever want a low-power tuning for a long flight, flattening the top of the frequency curve buys more than muting ever will.
Where the two methods disagree — and it is exactly a factor of two
Same volume levels, same simulated +1 m/s climb, same firmware behaviour. The sound term alone:
| Volume | via C·dV/dt on the bank | via USB tester, direct | Ratio |
|---|---|---|---|
| 1 | 106 µA | 206 µA | 1.94 |
| 2 | 255 µA | 458 µA | 1.80 |
| 3 | 487 µA | 993 µA | 2.04 |
The shape matches beautifully. Normalised, the indirect run gives 1 : 2.4 : 4.6 across the three volumes and the direct run gives 1 : 2.2 : 4.8 — both well below the 1 : 4 : 9 that ideal capacitive theory predicts, both landing near k^1.35. Two instruments agreeing on a non-obvious exponent is a good sign.
The scale does not match, and it is not a small discrepancy hiding in noise: consistently, across all three levels, the bank says half of what the meter says. The barometer term agreed to 8 % in the same comparison, so this isn’t a global calibration error — it is specific to the buzzer.
My working hypothesis is charge redistribution inside the lithium-ion capacitor. An EDLC is not one
capacitance, it is a fast terminal capacitance in parallel with a slow porous branch behind an
internal resistance. The buzzer is a burst load: it draws hard for a couple of hundred milliseconds,
then goes quiet for as long again. Charge to cover those bursts can come partly out of the slow
branch and be repaid without the terminal voltage ever tracking it, and terminal voltage is the only
thing C·dV/dt can see. A steady load like the barometer doesn’t excite that mechanism, which fits
exactly the pattern above — steady terms agree, bursty terms don’t.
I want to be careful here: that’s a hypothesis consistent with the data, not a demonstrated
mechanism. The clean experiment is to put the tester on a unit with its capacitor fitted and
compare, which is next on the bench. The capacitance itself is not in doubt — the bank is marked
11 mWh, and C = 2E/(V₁²−V₂²) over its rated 3.8→2.5 V window gives 9.7 F against a 10 F datasheet
value.
What I’d tell someone measuring their own low-power board
- Measure your floor before you measure your device. Turn the target off in situ and read the meter. If you can’t turn it off, unpopulate it. Anything you don’t subtract, you’ll later attribute to your own firmware and optimise in the wrong place.
- A meter in series is worth a lot more than a clever indirect method, when you can use one. Twelve minutes versus a week isn’t a convenience difference, it’s the difference between measuring four modes and mapping a whole curve. I’d never have found the sink-tone cliff or the frequency dependence one 8-hour discharge at a time.
- Indirect methods aren’t wrong, they’re band-limited. The bank-as-ammeter trick nailed the steady terms and matched the direct meter to 8 % on the barometer. It halved the bursty ones. Know which kind of load you’re pointing it at.
- Cross-check with a term both methods can see. One shared quantity measured two ways tells you whether a disagreement elsewhere is a calibration problem or a real physical effect. Without the barometer agreeing, I’d have had no way to tell which end of the factor-of-two was wrong.
- Automate the sweep, not just the reading. The whole point of a fast method is that you can afford twenty-seven operating points. That only pays off if setting a mode, waiting for it to settle and logging the result is one script and not twenty-seven manual steps.
The firmware being measured here is the same 0.26.0 that shipped to devices last night, including the nRF52’s internal DC/DC — which is its own story and worth 21 % on its own. The scripts, the raw CSVs and the plotting code live with the firmware repository; if you’re building something similar and want them, ask me.