Every pilot knows that a thermal drifts with the wind. You climb, you lose the core, and it turns out to be a little downwind of where you left it. The rule of thumb is to move your circle into the wind side of the drift and keep following it.
I needed a number rather than a rule. The thermal assistant in the FlyBeeper app remembers where you climbed well and where you did not, and to use those points it has to know where each of them has gone since — how far the air they were in has moved. My first measurements from my own tracks gave “about 0.6 of the wind”. Measurements across several pilots said something else: 0.3 near the slope, 0.7 higher up. Both were done carefully. Both could not be the whole story.
The trouble is that one pilot measures two things at once and cannot tell them apart. The centre you circle around moves for two reasons. The column may lean: climb a hundred metres, and the core at your new height is somewhere downwind of where it was. And the column may drift: wait a minute, and the whole thing has moved. A climbing pilot does both at the same time, so a single track gives you only the sum.
To separate them you need several pilots in the same thermal, in the same minute, at different heights. That is exactly what a competition gaggle looks like.
A hundred pilots in one thermal
Competition scoring servers publish every task’s tracks. airscore.fai.org has the IGC files of each scored task as one archive. I took every paragliding competition on it that had scored tasks with a working archive: 28 competitions, 104 tasks, 18 sites in twelve countries — Slovenia, Italy, France, Portugal, the Czech Republic, Serbia, North Macedonia, Greece, Turkey, Brazil, the USA and Canada — plus two of my own free-flying days at Kobarid. Nearly all files come from Flymaster instruments: one fix per second, with a live barometer. On a busy day that is a lot of pilots circling in the same air: 217 at Kobarid, 133 at Kruševo.
Pilots’ names play no part in any of this and do not appear anywhere below.
From circles to an axis
Every full turn of a pilot gives one point: here, at this height, at this moment, was the middle of the circle. The mean position over one full turn is exactly the centre of the circle as drawn in the air, at the middle of the turn — the wind drift of the glider itself cancels out.
Then, for every thermal, I fit a straight axis that is allowed to lean and to move:
Here is the centre of the circle, the height and the time. is the lean, in metres sideways per metre of height. is the drift of the whole column, in metres per second. A lone climbing pilot sees and nothing else. With pilots at different heights in the same minute, and come apart.
Physics suggests two limiting cases. A plume from a fixed source on the ground stays where it is and is laid over by the wind: air rising at in a wind travels metres sideways for every metre up, so and . A bubble that has left the ground stands upright and goes with the air around it: , close to the wind.
A big start gaggle is not one thermal. At Kobarid on 27 August 2023, a simple clustering of circle centres glued 210 pilots over an hour and three kilometres into one “thermal”. So the gaggle is cut into ten-minute slices. In each slice I look for the straight axis with the most circles within 110 m of it, take those circles out, and look for the next one. This is called a sequential RANSAC. A thermal counts if it has at least three pilots, 250 m of height, pilots at different heights within the same minute, and some wind to lean in. Circle centres scatter around the fitted axis by 40–65 m, about a circle’s radius.
That leaves 8,409 thermals.
Three thermals you can turn around
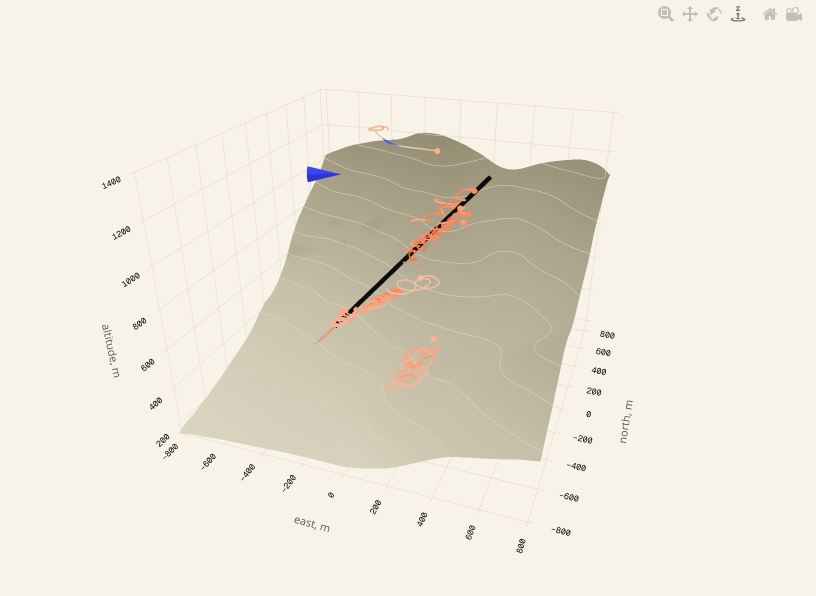
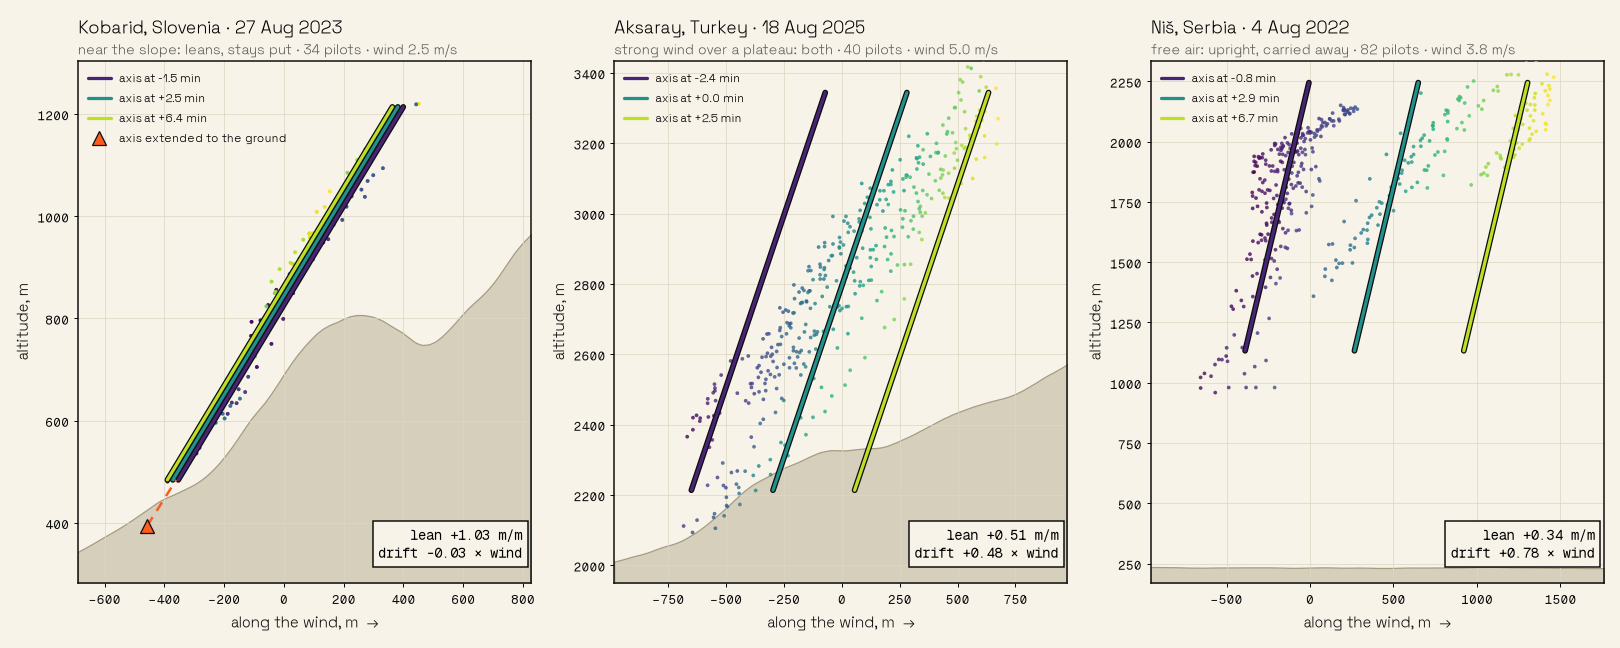
Three thermals, one for each way a thermal can behave; switch between them with the buttons under the view. Here are the same three from the side, looking across the wind. Each dot is the centre of one circle, coloured by time. The three lines are the fitted axis at the beginning, the middle and the end of the thermal’s life, each in the colour of the dots of that moment. The lean shows in every line; the drift is the gap between them.
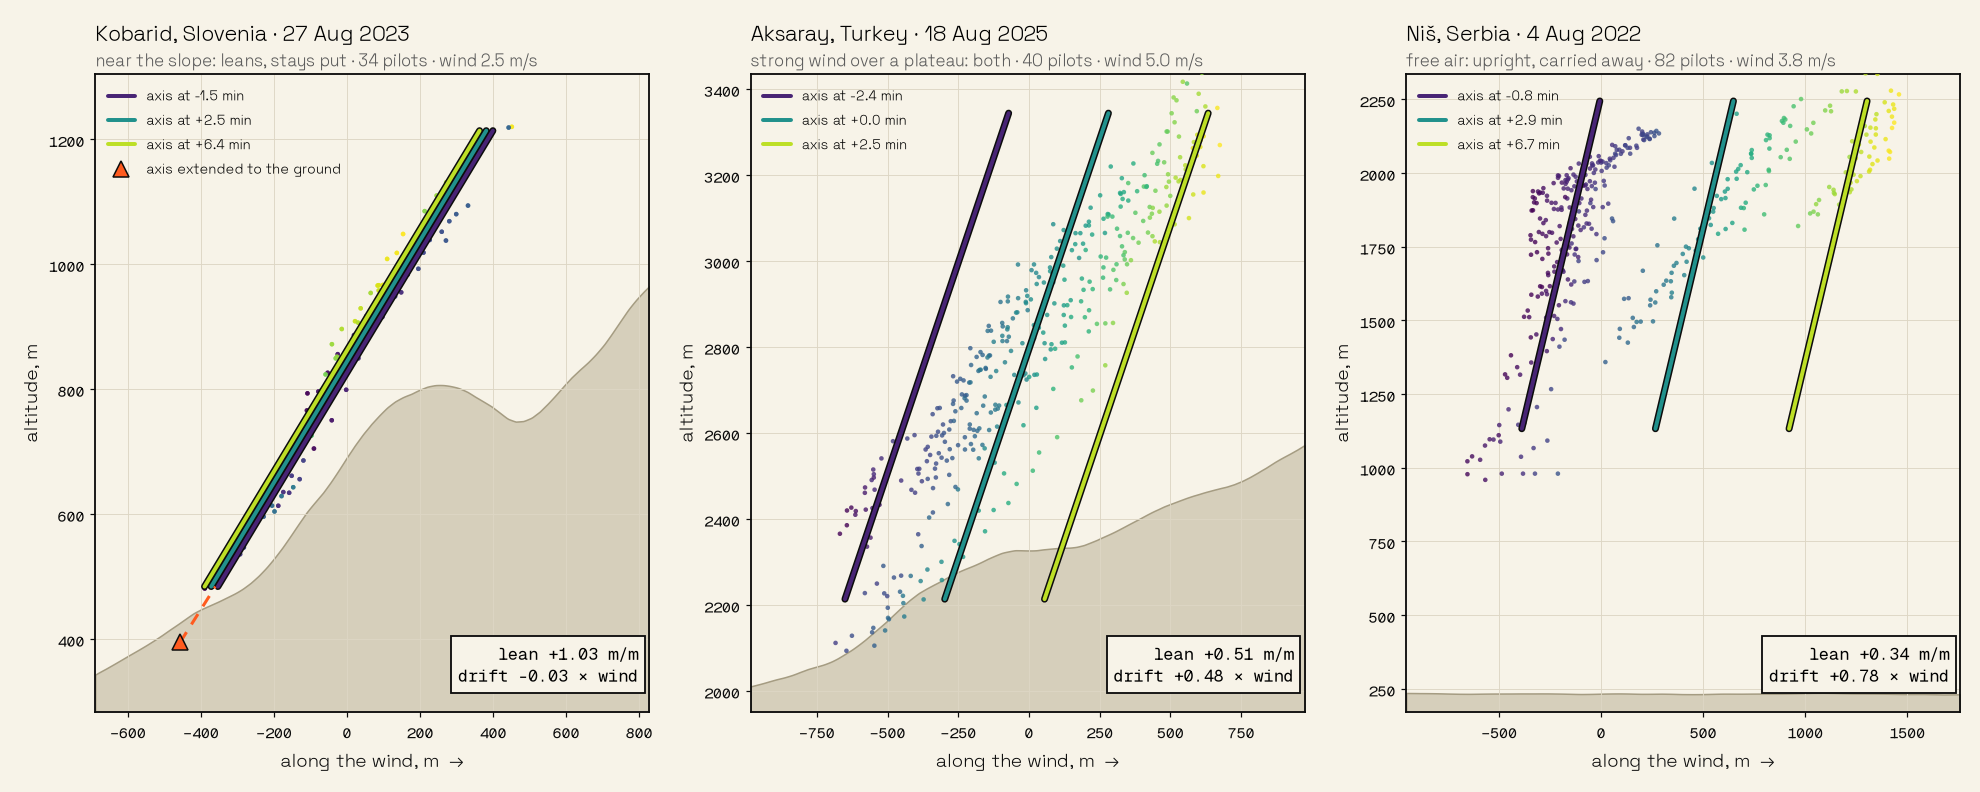
At Kobarid the three lines lie on top of each other: the column does not move at all. It is laid over at 45°, parallel to the slope and about a hundred metres above it, and the lower pilots circle a good three hundred metres upwind of the higher ones. Extended downwards, the axis meets the ground on the slope — where this thermal leaves it.
At Niš, 1600 m above the plain, it is the other way round. The column stands almost upright, and the whole stack of 82 pilots slides downwind — 1.3 km in eight minutes, at 0.8 of the wind.
Aksaray, in 5 m/s of wind 500 m over a plateau, does a little of both.
The numbers
Sorted by how high the middle of the axis is above the terrain under it. The lean is in metres sideways per metre of height (m/m). The drift is a share of the wind speed (× wind): 0.5 means the column moves at half the wind.
The lean across the wind is a control. The wind cannot lay a thermal over sideways, so any lean in that direction would come from the method, not from the air. It should be zero.
| Axis above the terrain | Thermals | Lean along the wind, m/m | Lean across (control) | Column drift, × wind | A climbing pilot sees, × wind |
|---|---|---|---|---|---|
| below 300 m | 1216 | +1.00 | +0.02 | 0.17 | 0.66 |
| 300–600 m | 1651 | +0.43 | −0.01 | 0.51 | 0.78 |
| 600–900 m | 1681 | +0.26 | −0.01 | 0.64 | 0.83 |
| 900–1500 m | 3010 | +0.19 | −0.00 | 0.68 | 0.83 |
| above 1500 m | 851 | +0.14 | −0.00 | 0.68 | 0.80 |
Medians. The spread is wide — near the ground the middle half of the thermals lean anywhere from 0.4 to 1.6 m per metre — so these describe the typical thermal, not every one.
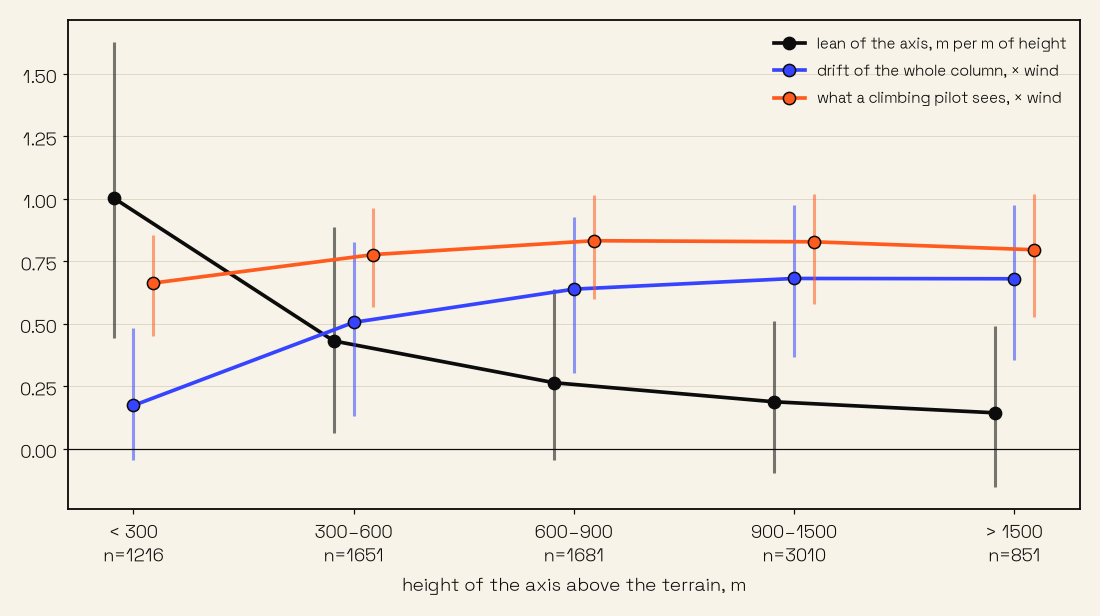
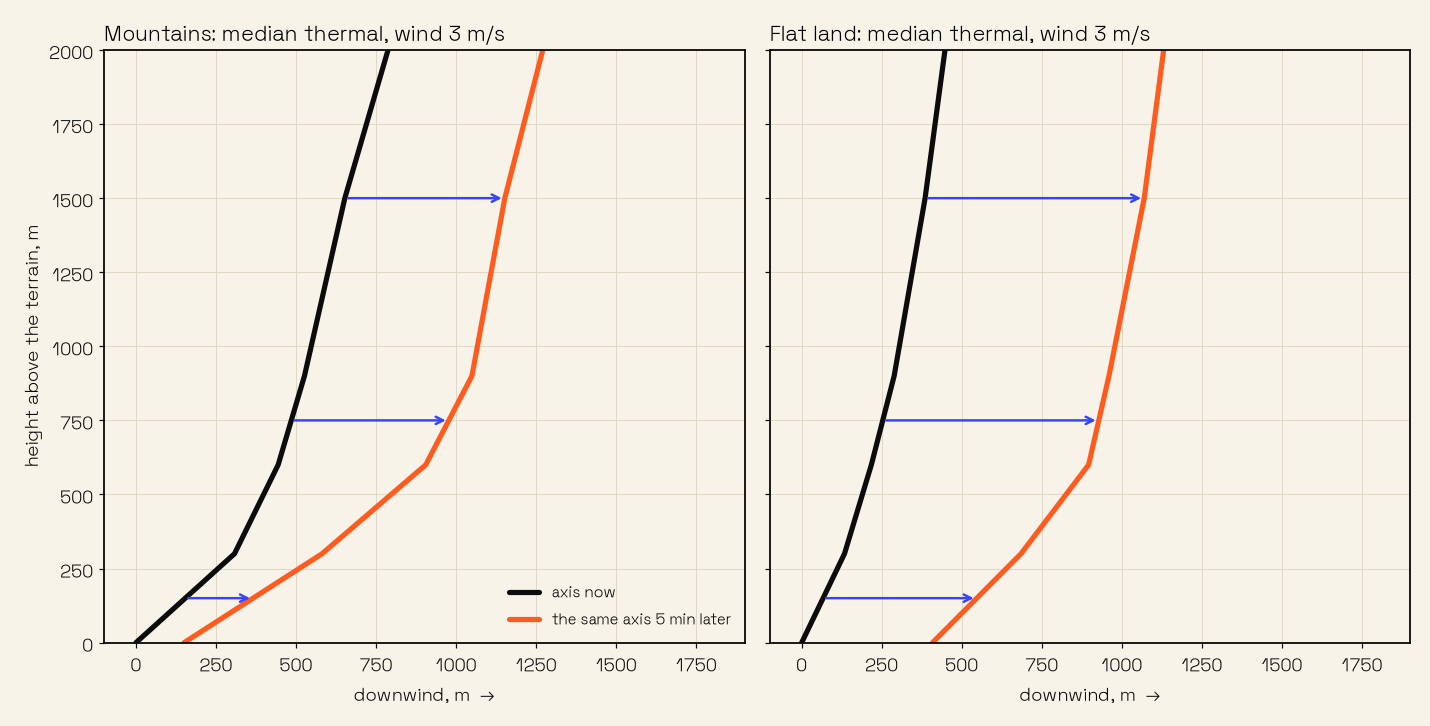
Near the terrain the thermal behaves like a plume: it stays put and the wind lays it over. From 600 m up it turns into a column that is carried along with two thirds of the wind and leans only a little.
The last column is the interesting one. It is what a lone pilot sees while climbing: height and time pass together, so the centre of the circles moves by the drift of the column and by the lean on the way up, and the pilot gets only the two added up. Drift plus lean times climb comes out at 0.66–0.83 of the wind at every height. Near the ground it is mostly lean; high up it is mostly drift; the pilot in the core cannot feel the difference. That settles my contradiction. The 0.6 from my own tracks was this sum. The 0.3 near the slope from the several-pilot measurement was mostly the drift of the column, because pooling many pilots at many heights averages the lean away.
Mountains and flat land
The low, rooted plumes come almost entirely from mountain sites. Splitting the thermals by how rugged the ground is — the spread of terrain heights within 5 km of the thermal — shows two different pictures.
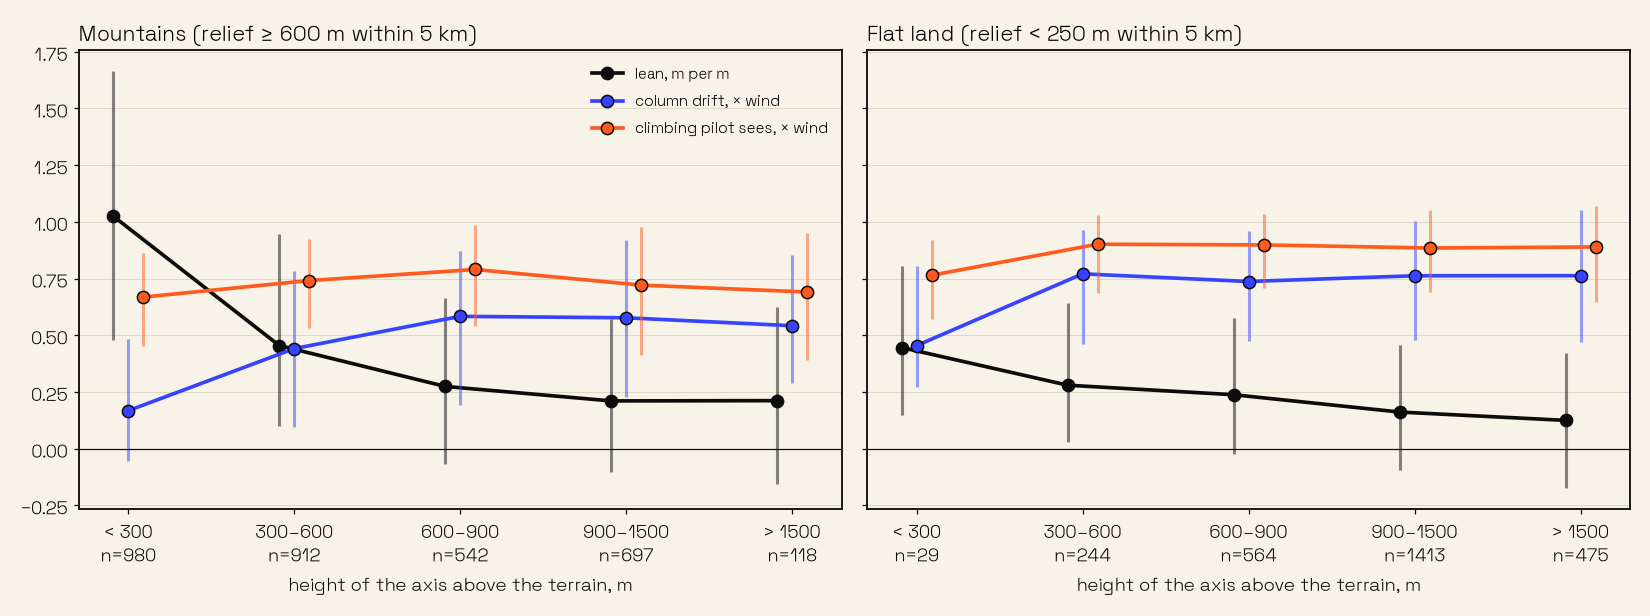
In the mountains: 3,249 thermals with at least 600 m of relief around them
| Axis above the terrain | Thermals | Lean along the wind, m/m | Lean across (control) | Column drift, × wind | A climbing pilot sees, × wind |
|---|---|---|---|---|---|
| below 300 m | 980 | +1.02 | +0.03 | 0.17 | 0.67 |
| 300–600 m | 912 | +0.45 | −0.03 | 0.44 | 0.74 |
| 600–900 m | 542 | +0.27 | +0.01 | 0.58 | 0.79 |
| 900–1500 m | 697 | +0.21 | +0.01 | 0.58 | 0.72 |
| above 1500 m | 118 | +0.21 | −0.05 | 0.54 | 0.69 |
Over flat land: 2,725 thermals with less than 250 m of relief
| Axis above the terrain | Thermals | Lean along the wind, m/m | Lean across (control) | Column drift, × wind | A climbing pilot sees, × wind |
|---|---|---|---|---|---|
| below 300 m | 29 | +0.45 | −0.07 | 0.45 | 0.76 |
| 300–600 m | 244 | +0.28 | −0.03 | 0.77 | 0.90 |
| 600–900 m | 564 | +0.24 | −0.03 | 0.74 | 0.90 |
| 900–1500 m | 1413 | +0.16 | +0.00 | 0.76 | 0.88 |
| above 1500 m | 475 | +0.12 | +0.02 | 0.76 | 0.89 |
In the mountains a thermal close to the ground is tied to it. The lean there is 0.92 of what a plume from a fixed source should have — the wind over the rising speed — and the column barely moves. Over flat land the thermal lets go early: already between 300 and 600 m above the ground it drifts at three quarters of the wind and leans only 0.3 m per metre, and a climbing pilot sees about 0.9 of the wind at any height. Low flat-land thermals are rare in competition tracks — 29 of them below 300 m — so the very bottom of the flat-land picture is the least certain part of it.
Put together, the median thermal of each kind looks like this. It is a composite — the lean and the drift of each height band come from the thermals whose middle sits in that band — but it is the picture an assistant needs.
Every site
Sorted from the most rugged surroundings to the flattest. The site with fewer than ten usable thermals (Saint-Pierre-d’Albigny, a windless day) is left out.
The table by site
| Site | Competitions · tasks | Thermals | Relief, m | Axis above terrain, m | Wind, m/s | Lean along, m/m | Across (control) | Column drift, × wind | Pilot sees, × wind |
|---|---|---|---|---|---|---|---|---|---|
| Golden, Canada | 1 · 4 | 156 | 1273 | 389 | 3.1 | +0.63 | −0.06 | 0.18 | 0.69 |
| Monroe, Utah, USA | 1 · 3 | 101 | 1164 | 832 | 4.6 | +0.43 | +0.06 | 0.58 | 0.83 |
| Tolmin / Kobarid, Slovenia | 1 + 2 free days · 5 | 238 | 1030 | 275 | 2.5 | +0.99 | +0.00 | 0.19 | 0.67 |
| Borso del Grappa, Italy | 2 · 6 | 687 | 986 | 327 | 2.6 | +0.59 | −0.02 | 0.40 | 0.75 |
| Cuorgnè, Italy | 1 · 3 | 76 | 964 | 241 | 2.6 | +0.81 | +0.04 | 0.30 | 0.72 |
| Ajdovščina, Slovenia | 2 · 6 | 139 | 880 | 323 | 2.7 | +0.65 | −0.03 | 0.29 | 0.70 |
| Drama, Greece | 1 · 3 | 18 | 863 | 354 | 2.5 | +0.22 | +0.07 | 0.54 | 0.69 |
| Kruševo, North Macedonia | 5 · 19 | 1863 | 568 | 920 | 2.5 | +0.22 | −0.01 | 0.60 | 0.77 |
| Siatista, Greece | 1 · 5 | 345 | 474 | 1119 | 2.9 | +0.25 | −0.01 | 0.66 | 0.85 |
| Chelan, USA | 4 · 17 | 2100 | 470 | 1088 | 3.2 | +0.31 | +0.01 | 0.59 | 0.81 |
| Sušice, Czechia | 1 · 3 | 39 | 460 | 615 | 2.4 | +0.47 | −0.03 | 0.55 | 0.71 |
| Montalegre, Portugal | 1 · 5 | 220 | 425 | 523 | 3.1 | +0.41 | +0.10 | 0.59 | 0.81 |
| Aksaray, Turkey | 2 · 13 | 1434 | 421 | 828 | 3.3 | +0.24 | −0.01 | 0.64 | 0.81 |
| Niš, Serbia | 1 · 6 | 603 | 405 | 908 | 3.9 | +0.24 | −0.03 | 0.67 | 0.82 |
| Andradas, Brazil | 1 · 3 | 250 | 291 | 1004 | 4.0 | +0.20 | −0.03 | 0.73 | 0.89 |
| Baixo Guandu, Brazil | 1 · 1 | 76 | 237 | 644 | 1.7 | +0.31 | +0.02 | 0.37 | 0.72 |
| Itaocara, Brazil | 1 · 3 | 63 | 209 | 687 | 2.3 | +0.34 | −0.02 | 0.62 | 0.84 |
| All | 28 + 2 free days · 106 | 8409 | 520 | 838 | 3.0 | +0.32 | −0.01 | 0.58 | 0.79 |
The order tells the story. Where the relief is close to 900 m or more — Golden, Kobarid, Cuorgnè, Ajdovščina, Borso del Grappa — thermals are worked low, lean at 0.6–1.0 and drift at 0.2–0.4 of the wind. Where it is under 500 m — Aksaray, Niš, Chelan, Andradas — they are worked high, mostly lean at 0.2–0.35 and drift at 0.6–0.7 of the wind; the one-task, light-wind day at Baixo Guandu drifts less. Monroe in Utah is rugged but flown 800 m above the ground in 4.6 m/s of wind, and sits in between. Across the wind the lean is zero at every site.
Does the axis bend?
On average, yes — the median thermal above is clearly curved. Inside one thermal, much less. Fitting a curve to each thermal separately, the lean at the top comes out smaller than at the bottom in 52.9 % of them, against 49 % for the same test across the wind — real (p ≈ 10⁻⁷, which means the difference is not chance), but small: in the mountains the lean drops from 0.52 to 0.43 over the 540 m of a typical thermal centred 300–600 m above the ground, and from 0.28 to 0.21 higher up. The difference between thermals at different heights is several times larger than the bend within any of them.
So the curve is there, but it comes from many thermals, not from the one you are in. To draw it in the air you need pilots at other heights.
The wind, or the slope?
Near the ground most mountain thermals sit over a slope, and air flowing up a warm slope follows it. A thermal leaning parallel to the hillside might be doing just that, with the wind playing no part.
It can be checked. Where the wind blows down the slope under the thermal — 1,480 cases with a slope steeper than 10 % — a slope-following column would lean uphill, into the wind. It does not: it leans downwind by 0.43 m per metre, and so leans away from the hill, by 0.36 m per metre.
| Wind relative to the slope under the axis | Thermals | Lean along the wind, m/m | Lean up the slope, m/m |
|---|---|---|---|
| blowing up the slope | 1,912 | +0.45 | +0.37 |
| across the slope | 1,584 | +0.45 | +0.04 |
| blowing down the slope | 1,480 | +0.43 | −0.36 |
The lean follows the wind whichever way the hill faces. And across the wind there is no lean at all: the sideways component is zero, spread evenly on both sides.
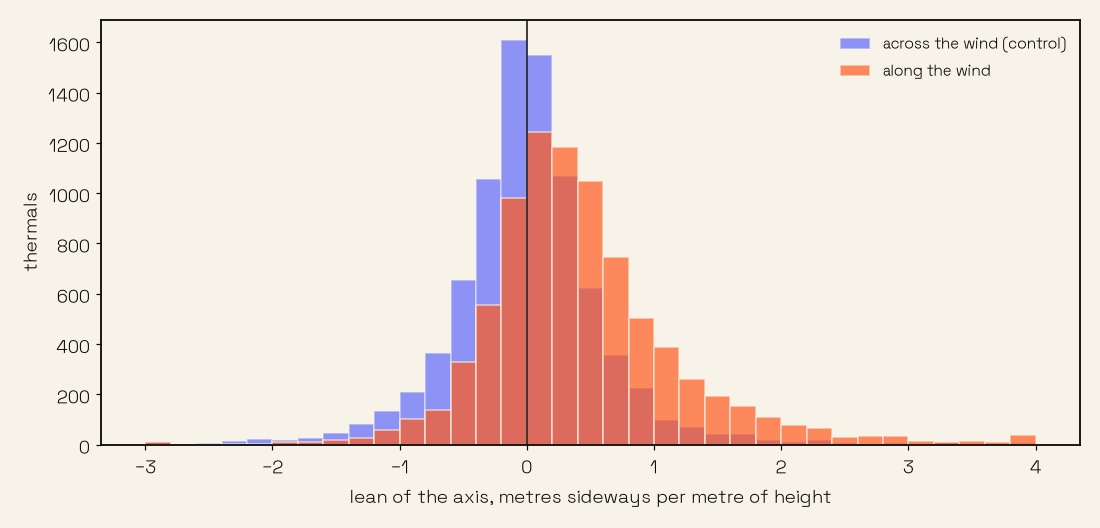
Could the method invent the lean?
A RANSAC that picks the most populated straight line out of a cloud of points could, in principle, find slopes that are not there. Two checks, run on the first 865 thermals.
First, I shuffled the heights of the circles inside every cluster — keeping positions and times, breaking any link between height and position — and ran the whole pipeline again. The lean came out at 0.00 at every height, and the drift took up all the motion, as it should.
Second, the knobs. A tolerance of 80, 110 or 150 m around the axis and slices of 6, 10 or 15 minutes give 0.95–1.00 m per metre near the ground and 0.16–0.20 above 600 m. The numbers do not depend on the settings.
What the radio can do
Everything above came from IGC files downloaded after the task. In the air, the same pilots are on the radio. The FlyBeeper FANET vario hears two protocols, and the app decodes both: FANET, and since this year ADS-L.
They differ in how often a pilot is heard. ADS-L sends a position once a second — the rate of the IGC files this whole analysis is built on. From ADS-L the app gets spirals as good as the ones above. FANET sends every 5 seconds on a quiet band and stretches the interval as the band fills, 5 seconds more for every ten neighbours, so in a gaggle of fifty you hear each pilot about every 30 seconds — roughly once per circle.
Is one position per circle enough? A FANET packet carries more than a position: altitude, speed, heading and turn rate. With the wind taken from your own circling, speed over turn rate is the radius of that pilot’s circle, so every single packet puts its own circle centre on the map. I replayed the competition tracks as FANET packets — GPS altitude to the metre, climb to a tenth, turn rate to a quarter of a degree per second, each pilot at a random phase — every 5, 10, 20 and 30 seconds, and ran the reconstruction on them the way an app would, with no knowledge of the answer: take the packets around the thermal, pick the most populated axis, fit it. On six sites, against the same procedure on full one-second tracks, the lean came out within 0.05–0.14 m per metre and the drift within 0.03–0.07 of the wind. Whether a pilot is heard every 5 seconds or every 30 made almost no difference.
What does limit it is telling your core from the next one. In an ordinary gaggle, one thermal’s lean from the radio is good to about ±0.1–0.2 m per metre and its drift to ±0.1 of the wind; in a pre-start crowd of two hundred pilots over one ridge, closer to ±0.4.
Does it work from the radio?
Before the field, a replay. I took three gaggle days — Kobarid on 27 August 2023, Aksaray on 18 August 2025 in 5 m/s of wind, Niš on 4 August 2022 over flat land — and fed each into the FlyBeeper app as if heard over the radio, with three pilots in turn as the one carrying the phone: ADS-L once a second, and FANET every 10 and every 30 seconds. The app saw only what it would have heard up to that moment. Where it put the core at the pilot’s height was compared with the axis fitted afterwards from the full one-second tracks of everybody in that thermal.
| Day | Axis from the radio, share of the time in a thermal | Core from the app to the core from the full tracks | Your own circles around the same axis |
|---|---|---|---|
| Kobarid, mountains | 57–66 % | 52–55 m | 49 m |
| Aksaray, wind over a plateau | 56–65 % | 53–57 m | 58 m |
| Niš, flat land | 76–85 % | 69–78 m | 54 m |
Medians over the three pilots and the three kinds of radio, leaving out the few thermals where the full-track axis itself is implausible. The pilot’s own circles scatter around the axis by 49–58 m — closer than that the full tracks cannot tell. In the mountains and at Aksaray the app finds the core about as well as the pilot circling in it. At Niš it lags: that column drifted at 0.85 of the wind, and the app, leaning on the typical flat-land thermal, took it at about three quarters. FANET every 30 seconds did as well as ADS-L every second.
What it changes
The practical conclusion is about the radio. A phone with a receiver that hears FANET and ADS-L has everything it takes to rebuild the thermal around it from the neighbours’ tracks: where the core is at each height, whether the column is tied to the ground or drifting, and how much. The FlyBeeper thermal assistant now does this, in three layers. For now it is an experimental setting, Thermal assistant, off until you switch it on.
With pilots above or below you in your own thermal, it fits the axis of that thermal from what it hears and shows the core at your height, not at theirs, as a ring on the map with the number of pilots it was built from. A gaggle 300 m higher near a slope marks a point about 300 m downwind of where you should be looking; high above flat land they are nearly straight above the core, which has drifted since they found it. The ring appears as you glide towards a gaggle, before you start to turn.
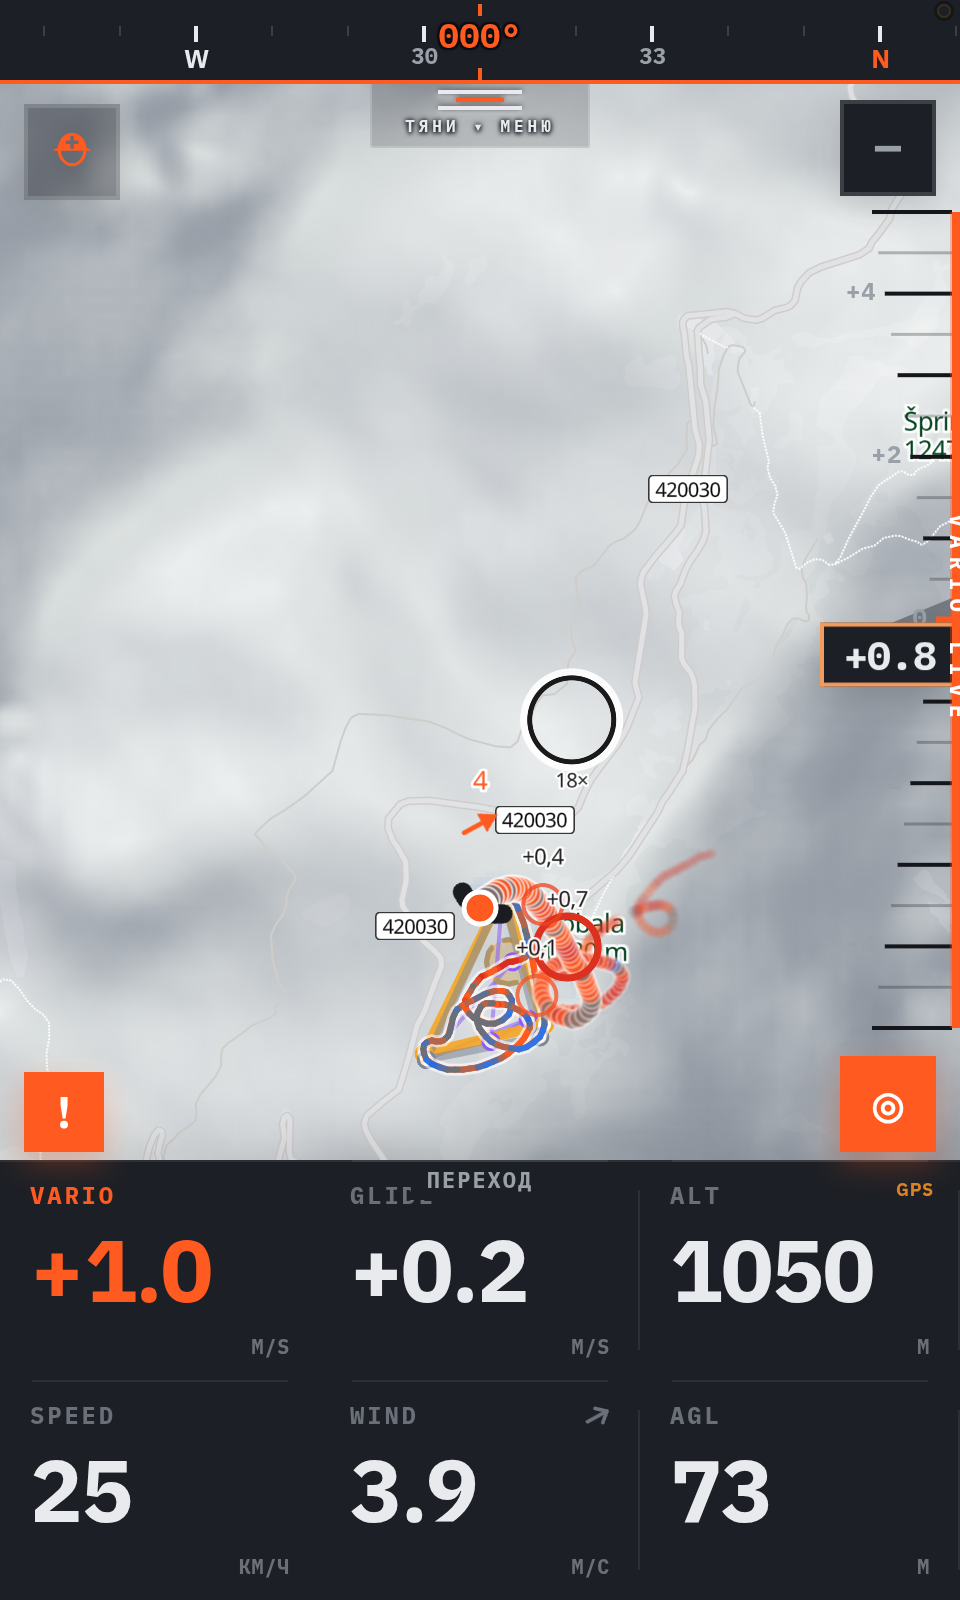
With pilots around but not in your thermal, it takes the typical lean and drift of the thermals it has heard today: on a given day, at a given site, thermals behave much alike. The phone keeps them until local midnight.
With nobody around, it falls back on what these 8,409 thermals say about the kind of ground below: in the mountains, tied down and laid over near the terrain, drifting at a little over half the wind higher up; over flat land, drifting at three quarters of the wind from a few hundred metres up.
For your own track the app used to have one drift factor: 0.3 of the wind near the slope. It came from the several-pilot measurement, so it was mostly the drift of the column. But in your own climb you see the drift plus the lean, and near the slope 0.3 is about half of what you actually see there.
That factor is gone. The app now uses the sum, drift plus lean times climb, from the tables above. It picks the value for your height above the terrain and the kind of terrain below. For one pilot a single number is still the right one. In a climb height and time move together, and splitting them into a lean and a drift only adds noise.
I checked it on 10,881 circling segments from the same tracks. Below 600 m the centres of consecutive circles line up 7–11 m better than with the old factor.
The lean and the drift as separate numbers are needed where pilots at different heights come together, in the axis from the radio.
For thermals that stay put there is a bonus: the axis extended to the ground is where the thermal leaves it. Collected over many days from the radio, that is a map of house thermals with the direction they lean on a given wind. That one is not built yet.
The same tracks answer the other half of the question — where the thermal ends and how to know before you get there. That is the next article.
Limits
- The axis is a straight line. Within a ten-minute slice the model is linear; the bend within one thermal is small, and the curve above is a composite of many thermals.
- Low thermals over flat land are rare here: 29 below 300 m above the ground. Competitions over flat country start high, and that part of the picture is the least certain.
- The climb of the air is rough. It is the pilot’s climb plus a fixed allowance for the glider’s sink in a turn, so “wind over climb” is good to about ±30 %.
- Competition days are good days. Racing pilots fly strong, busy thermals; a weak, lonely thermal at 5 pm is not in this sample.
- The radio replay assumes everyone transmits and is heard. In the air some pilots carry no FANET or ADS-L at all, and some packets are lost.
- A replay is not a flight. The app has not been checked in the air yet.
- The calm French Open task produced one usable thermal: without wind there is nothing to lean in, and the method needs some.