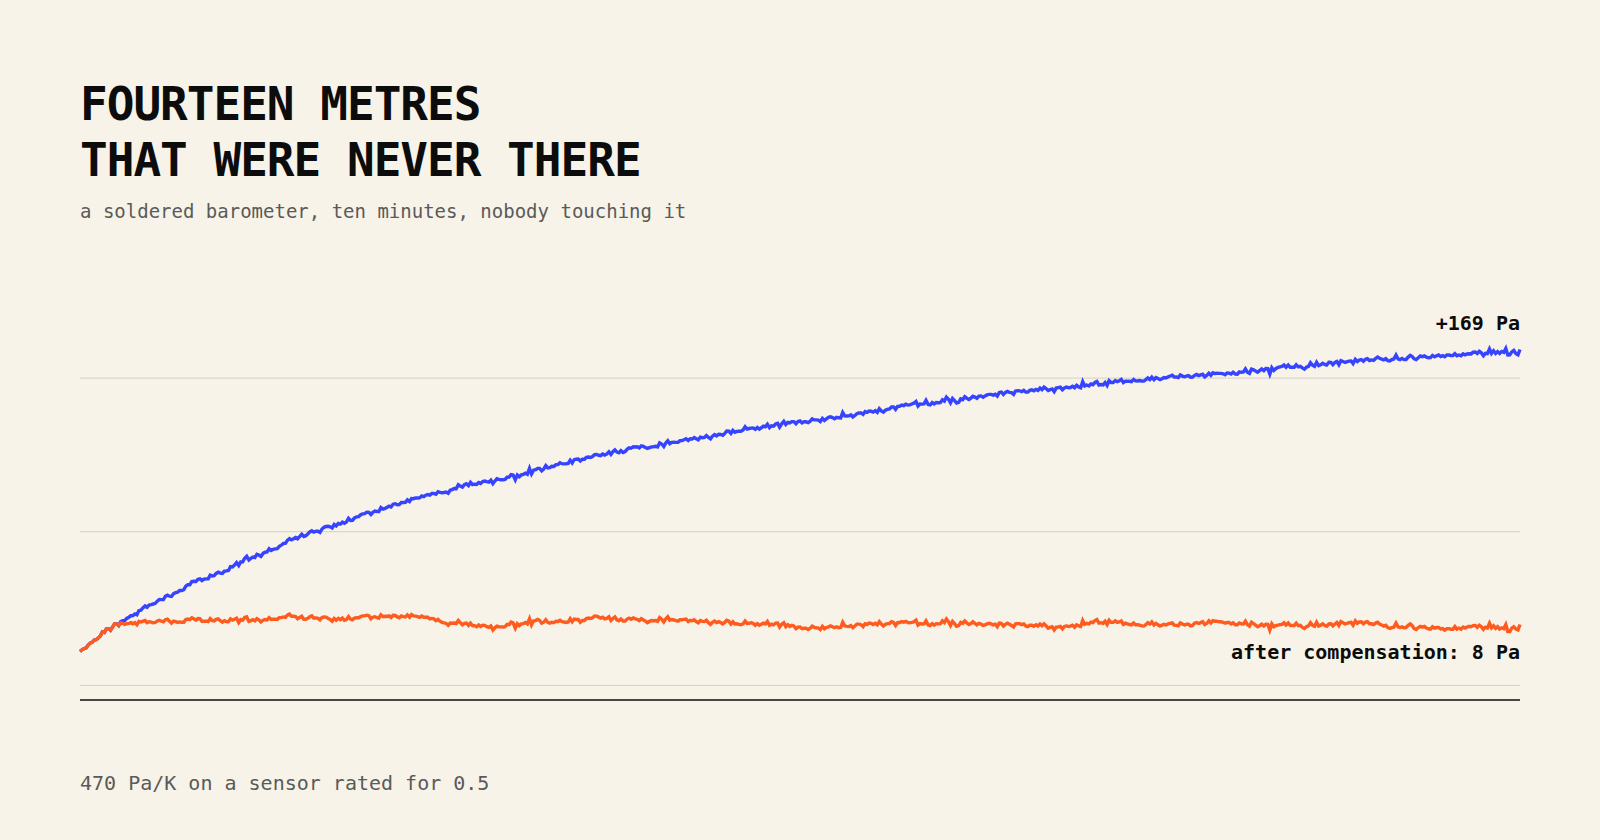
A variometer does not measure height. It measures air pressure, very precisely, and then tells you how fast that pressure is changing. Near sea level one metre of altitude is about 12 pascals, so a device that wants to resolve a 10 cm/s climb has to see roughly 1.2 Pa per second out of an absolute pressure of around 100 000 Pa. That is one part in a hundred thousand, repeatedly, from a chip the size of a grain of rice.
Sensors like that exist and they are cheap. What the datasheet will not tell you is what happens to one after you solder it — and while everybody who assembles these things knows it happens, I have never seen anyone attach a number to it. So here is the number.
The symptom: a device that climbs while sitting still
One of my SunVario units — call sign FBSV.0126 — had been showing
slow swings in absolute altitude. Not noise, not a jump: a smooth, patient wander of a dozen metres
over minutes, while the device lay on a desk with nothing moving anywhere near it.
The audio vario barely reacted. Its filter is a differentiator with a short memory, and a drift that slow slips underneath it. But the altitude number on the phone kept sliding, and a flight recording made with that device would have a slow ramp baked into it.
Here is the full picture, taken after the device had been powered on and left alone for ten minutes:
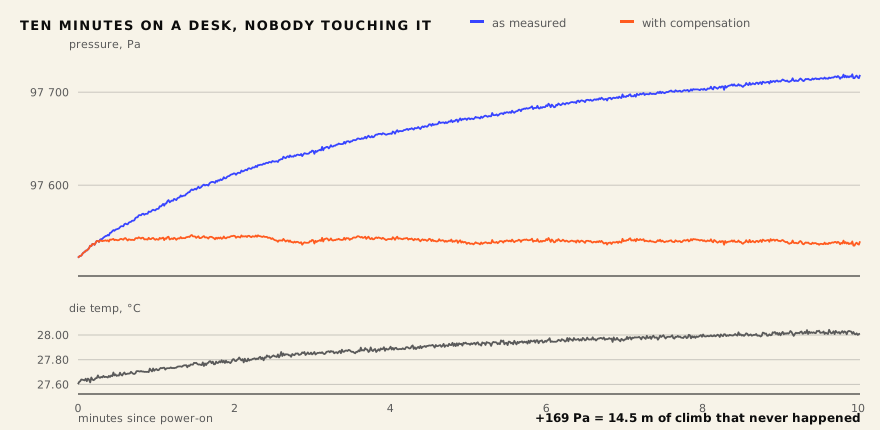
The blue line is the device warming itself up. Nothing else happened. The pressure rose 169 Pa, which is 14.5 metres of altitude that never existed, and the die temperature rose by all of 0.36 K while it did.
Why a soldered barometer lies
The sensor is an SPL07-003, a MEMS pressure die in an LGA package. Inside, a thin silicon membrane flexes with pressure and a capacitance changes. The membrane also flexes with temperature, and with mechanical stress, and the factory knows this: every chip is calibrated and the correction coefficients are burned into one-time-programmable memory. Read the raw pressure count, read the raw temperature count, run the datasheet polynomial, get pascals. It works well — the datasheet promises the residual temperature coefficient stays inside 0.5 Pa/K.
Then you reflow it onto a board. The die, the package, the solder and the fibreglass underneath all expand at different rates, and when everything cools back down the package is left under permanent mechanical stress. That stress reaches the membrane. The membrane’s response to temperature is now different from the one the factory measured, and the OTP coefficients — which cannot be rewritten — are describing a chip that no longer exists.
This is a documented failure mode, not an exotic one. Merit Sensor’s application notes AN108 and AN109 are entirely about post-reflow offset shift and tell you plainly that the correction belongs in the consumer of the data, not the sensor. ST’s TN1383 covers the board-layout side of the same physics. Everyone in the MEMS business knows. It just does not appear in the part’s headline specs.
None of which is news to anyone who assembles these things. I have been killing barometers this way since the mini BT days, and I have always known exactly why. There is even a rule of thumb, and it holds: a sensor survives being soldered twice. The third time it almost never does. You rework a board, the altitude starts wandering, you write the part off and fit a new one, and you do not investigate because you already know what happened.
What I had never done is put a number on it. Knowing the mechanism tells you which part to bin. It does not tell you how far gone a particular one is, whether it can be rescued in software, or — the question that turned out to matter — whether the damage hurts an altimeter and a variometer the same way. This article is that old, well-understood failure finally measured.
This unit, FBSV.0126, earned it honestly: an LDO was hand-soldered next to the sensor and the
iron got the lid hot.
My first pass at the number was wrong by a factor of 25.6
Before any of the careful work, I did what you do: subscribed to the device’s Bluetooth pressure characteristic, logged for five minutes, fitted a slope. Out came 15.9 Pa/K — thirty times the datasheet, bad but not absurd, and a swing of 2.6 Pa which I confidently converted into 22 metres.
Two of those three numbers were wrong.
The Bluetooth Environmental Sensing Service reports pressure in units of 0.1 Pa. My firmware stores it internally in units of 1/256 Pa and converts on the way out, which I had forgotten. Every pressure figure in that first analysis was 25.6 times too small. And the altitude conversion had slipped by two orders of magnitude in the other direction: 1 Pa is 0.084 m, not 8 m.
The two errors partly cancelled, which is exactly why neither of them looked wrong. The real numbers from that same five-minute log are a 66 Pa swing and about 410 Pa/K.
When a measurement passes through a unit conversion you did not write down, it is not a measurement yet. Everything below comes from raw sensor counts, and the pascals are computed once, at the end.
Measuring it properly: raw counts and a bit-exact model
The Bluetooth pressure characteristic is the wrong instrument for this job anyway. It is filtered, averaged, rate-limited to 10 Hz, and the temperature next to it updates once every five seconds and is quantised to 0.01 °C. That is fine for a flight app and useless for characterising a sensor.
So I added a debug channel to the firmware, behind a Kconfig option that is off in production builds. Over the Nordic UART Service it streams the raw 24-bit pressure and temperature counts at the full 62.5 Hz sampling rate, in 14-byte packets, plus the chip’s OTP calibration coefficients on request. Nothing filtered, nothing converted.
That last part is what makes the whole thing cheap. With the raw counts and the coefficients, the entire signal chain can be reproduced on a laptop: the datasheet polynomial in single precision, the integer Butterworth filters, the median-of-three, the running average, the vario differentiator — right down to C’s truncate-toward-zero integer division. I checked it against the device: for raw counts of −546346 and 603872 the firmware reports 24 960 926 and the model on my laptop returns 24 960 926.
Once the model is exact, the device only has to record. Every parameter sweep in this article was run offline against logs that already existed, and the device was only brought back to confirm the answer.
Six runs, about 250 000 samples, no dropped packets.
Heating a device you cannot touch
To measure a temperature coefficient you need temperatures. The device was on a desk in another room and I had no hot-air gun, no climate chamber, and no hands.
So the heater went into the firmware too. A background thread at the lowest priority spins the CPU with a configurable duty cycle. At 40 % the nRF52 stops idling, consumption goes from roughly 0.25 mA to about 2 mA, and the board warms a few tenths of a degree. It is silent, it is a single Bluetooth command, and the profile is scriptable — heat for six minutes, then let it cool for eight.
0.48 K of swing turned out to be plenty.
The drift is 470 Pa/K, and it is entirely temperature
Two independent runs — the natural warm-up above and the forced heating cycle — agree:
| Run | What | ΔT | Pressure swing | In metres | Slope | r |
|---|---|---|---|---|---|---|
| 1 | ten minutes of warm-up | 0.36 K | 169 Pa | 14.5 m | 470 Pa/K | 0.999 |
| 3 | six minutes heating, eight cooling | 0.48 K | 208 Pa | 17.8 m | 477 Pa/K | 0.999 |
A correlation coefficient of 0.999 is the useful part. It says the wander is not weather, not the building’s ventilation, not a loose sensor: it is temperature, and only temperature. Whatever happened during soldering left a clean linear defect behind, which means a clean linear correction can remove it.
The magnitude is the unpleasant part. 470 Pa/K against a datasheet limit of 0.5 Pa/K is a factor of roughly nine hundred. Put the other way round: one hundredth of a degree of die temperature moves this sensor’s reported pressure by 4.7 Pa, which is 40 centimetres of altitude.
Heating and cooling trace the same line
This was the go/no-go test, and I ran it before writing a single line of correction code.
A linear correction can only fix a defect that behaves like a function. If the sensor’s pressure follows one curve while warming and a different curve while cooling — real hysteresis, the sort you get when the gel over the membrane has been damaged — then no coefficient exists that fits both, and the honest answer is to replace the part.
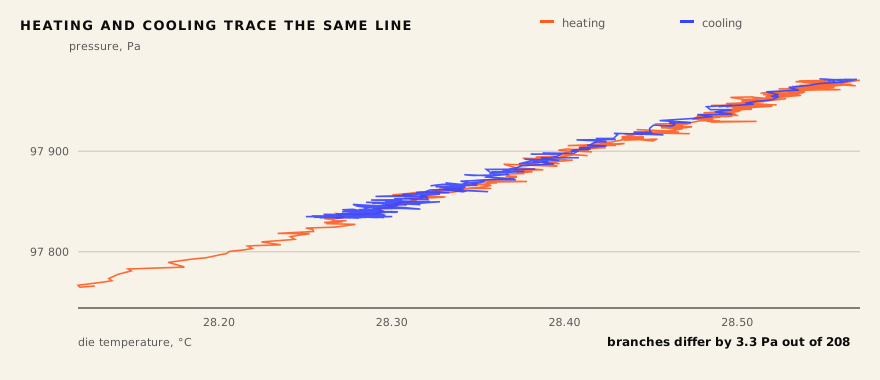
The branches sit on top of each other. Fitted separately they give 484 Pa/K going up and 507 Pa/K coming down, and over the temperature range they share, the two curves differ by 3.3 Pa on average and 7.3 Pa at worst — out of a 208 Pa total swing.
No hysteresis. The linear fix is allowed.
The fix imports the temperature sensor’s own noise
The correction itself is arithmetically trivial:
P_corrected = P − k · (T_average − T_reference)where k is measured per device, T_average is a moving average of the raw temperature counts,
and T_reference is that same average frozen once, shortly after start-up, so the correction
removes drift without touching the absolute offset. Thirty lines, one ring buffer, no floating
point.
And the first version of it made the vario measurably worse.
The correction multiplies temperature by 450 Pa/K. It does that to the signal, and it does it to the noise. The SPL07’s temperature reading at the oversampling setting I use has an RMS noise of roughly 0.03 K, which is completely irrelevant when temperature is only a small term in the datasheet polynomial. Multiplied by 450 Pa/K it becomes 14 Pa of pressure noise — about fifteen times the sensor’s own pressure noise, dumped straight into the signal the vario differentiates.
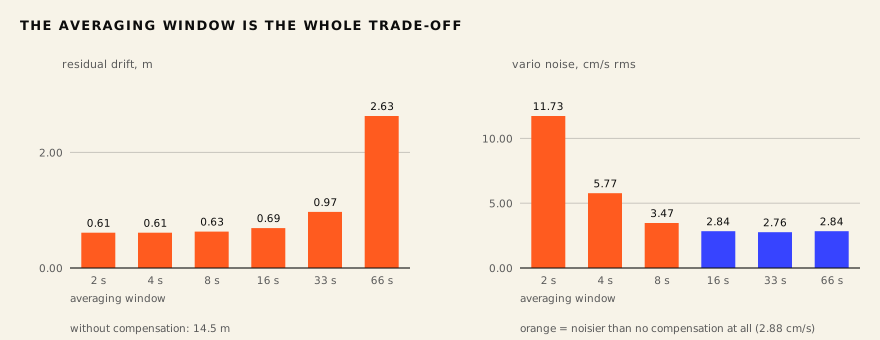
The escape is that the drift is slow and the noise is fast. Average the temperature hard enough and the noise falls as the square root of the sample count while the drift passes through almost untouched. How hard is “enough” is an empirical question, and this is exactly what the offline model was built for:
| Window | Residual drift | Vario noise |
|---|---|---|
| no compensation | 14.5 m | 2.88 cm/s |
| 2 s | 0.61 m | 11.73 cm/s |
| 4 s | 0.61 m | 5.77 cm/s |
| 8 s | 0.63 m | 3.47 cm/s |
| 16 s | 0.69 m | 2.84 cm/s |
| 33 s | 0.97 m | 2.76 cm/s |
| 66 s | 2.63 m | 2.84 cm/s |
A two-second window kills the drift beautifully and quadruples the vario’s noise floor. Sixteen seconds removes the drift by a factor of twenty-one and costs nothing at all — 2.84 cm/s against 2.88 cm/s uncompensated, which is to say the noise went very slightly down. Past that the average starts lagging the drift it is supposed to track and the residual climbs again.
I loaded sixteen seconds into the device, confirmed it against a fresh heating cycle — 21.0 metres of drift became 1.9 — and considered the problem solved.
Then I picked it up
The device had been on a desk for every measurement in this article. The first thing its owner did was lift it off the desk and put it back down.
The vario went the wrong way. Lower the device, and instead of showing sink it showed a sharp climb, held it for a few seconds, then swung hard into sink. Raise it and the climb did not appear at all. A vario that reads climb while you descend is not a vario with a tuning problem. It is unusable.
Here is what a minute of handling actually looks like in the raw data:
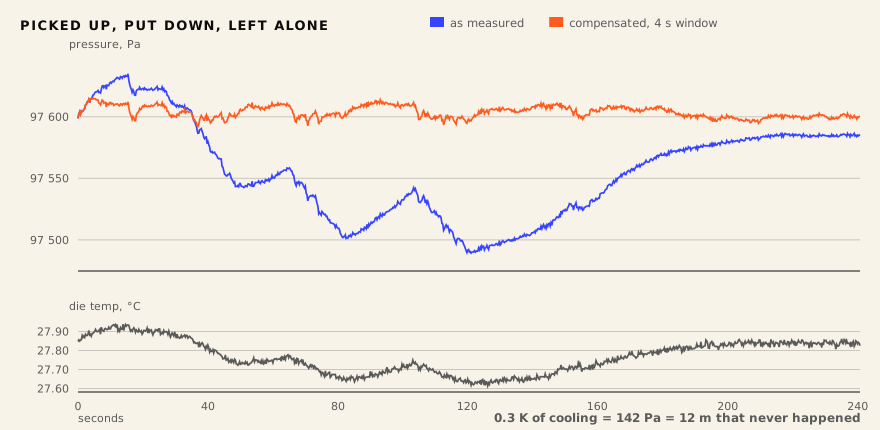
Moving the device through air cools it. That is all that happened here. The die temperature falls 0.29 K over about a minute of handling, the pressure follows it down 142 Pa, and 142 Pa is 11.9 metres. The actual altitude changes — lifting a small device forty centimetres off a desk — are worth 5 Pa, and they are somewhere inside that trace, invisible.
So the thing that ruins this sensor is not the slow warm-up I had spent two days characterising. It is any breath of air, and it is twenty-five times larger than the signal.
Sixteen seconds of averaging is far too slow for that. Refitting the model against this record — a first-order filter on the temperature, sweeping the coefficient and the time constant — puts the optimum three orders of magnitude away from where I had left it:
| Time constant of the correction | Residual swing |
|---|---|
| no compensation | 142.6 Pa |
| 0 s, instantaneous | 17.0 Pa |
| 1 s | 15.4 Pa |
| 4 s | 25.3 Pa |
| 16 s, what I had shipped | 64.9 Pa |
One second, and the sixteen I had shipped is four times worse than that. Note also how flat the top of the table is: going from one second to no filter at all costs ten percent. The residual is not the filter’s fault, and no filter will remove it.
The window’s length is what matters, not how many samples are in it
Shortening the window brings back the noise problem, so the obvious move is to sample temperature more often: more samples per second means more averaging for the same delay. The firmware reads temperature once every sixteen pressure cycles, every 256 ms, and I had already established that reading it on every 16 ms cycle costs nothing in throughput — a 6 ms temperature conversion and a 6 ms pressure conversion both fit inside the same tick.
The reasoning was right and the effect is almost absent. Holding the window at 8.2 seconds and varying only how densely it is filled:
| Samples in the window | Vario noise | Hand artefact |
|---|---|---|
| 64 | 2.96 cm/s | 2.25 m |
| 128 | 2.82 cm/s | 2.26 m |
| 256 | 2.69 cm/s | 2.28 m |
| 512 | 2.61 cm/s | 2.26 m |
Eight times the temperature conversions buys eleven percent. Whatever the correction is filtering out, it is not simple white measurement noise — if it were, four times the samples would have halved it.
So the ring buffer stays at 64 entries, and the only knob that matters is how much time those 64 samples span.
Re-tuned, and what it costs
The same sweep, run against both stimuli at once — the slow warm-up that started all this and the minute of handling that nearly ended it:
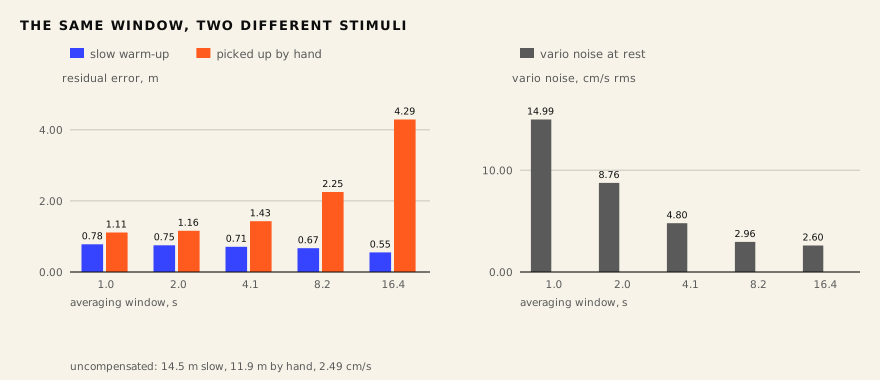
| Window | Slow drift | Hand artefact | Vario noise |
|---|---|---|---|
| no compensation | 14.5 m | 11.9 m | 2.49 cm/s |
| 1.0 s | 0.78 m | 1.11 m | 14.99 cm/s |
| 2.0 s | 0.75 m | 1.16 m | 8.76 cm/s |
| 4.1 s | 0.71 m | 1.43 m | 4.80 cm/s |
| 8.2 s | 0.67 m | 2.25 m | 2.96 cm/s |
| 16.4 s | 0.55 m | 4.29 m | 2.60 cm/s |
The slow column barely moves — every window in the table handles the warm-up, which is why the original bench test could not distinguish between them. The other two columns move by a factor of four and by a factor of six, in opposite directions.
There is no single right answer in that table, only a purchase: eight seconds halves the handling artefact and costs almost nothing in noise, four seconds cuts it to a third and doubles the noise.
And below about two seconds the purchase stops being worth making. Walking the window all the way down to nothing — the correction applied to each temperature reading as it arrives, no averaging at all:
| Window | Hand artefact | Vario noise |
|---|---|---|
| none, 0.06 s | 0.97 m | 37.2 cm/s |
| 0.5 s | 1.00 m | 27.8 cm/s |
| 1.0 s | 1.04 m | 17.1 cm/s |
| 2.0 s | 1.14 m | 10.1 cm/s |
| 4.1 s | 1.43 m | 4.8 cm/s |
From no filter at all to two seconds the artefact grows by seventeen percent and the noise falls by a factor of four. The artefact has a floor at about a metre and the filter is not what puts it there — that is the same seventeen pascals the time-constant fit ran into, the part a single linear coefficient cannot describe. You can spend an enormous amount of vario noise chasing that last seventeen percent and you will not get past it.
The control: a sibling that came in from the sun
All of the above is tuning. The question underneath it — is this sensor worth compensating or worth replacing — needed a reference, and one walked in: a second SunVario that had been outside in the sun, brought indoors warm and left to cool on the same desk. Same model, same firmware, no compensation, nothing special done to it.
It cooled 2.84 K in five minutes. Its reported pressure moved 7.5 Pa.
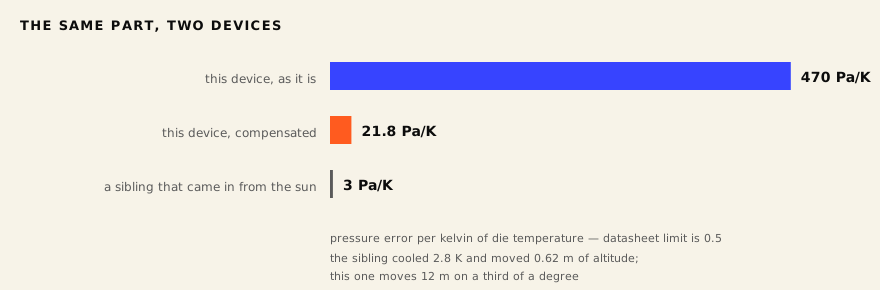
Three point zero pascals per kelvin. Ten times the datasheet’s promise, entirely normal for a soldered part, and utterly harmless: a temperature excursion eight times larger than anything the damaged unit experiences produced 62 centimetres of error.
The damaged unit does 470. That is a factor of a hundred and fifty between two devices off the same reel, running the same firmware, differing only in what happened at the soldering station. After compensation it does about 22 — a genuine twenty-fold improvement, and still seven times worse than its sibling achieves by doing nothing at all.
That ratio also explains why none of the tuning above can win. One temperature reading carries about 0.03 K of its own noise. On the damaged unit that noise is worth 460 × 0.03 = 14 Pa — 1.2 metres of altitude on every single sample, which is why it has to be averaged away and why the averaging costs lag. On the sibling the same 0.03 K is worth nine hundredths of a pascal. A healthy sensor could take this correction applied instantaneously, unfiltered, and never notice; it simply does not need one. Every trade-off in this article exists only because one coefficient is a hundred and fifty times too large.
And sampling temperature faster does not escape it, which is worth stating plainly because it is the first thing everyone proposes. Faster sampling raises the rate, not the quality: each reading still carries its own 0.03 K, and only averaging removes that. Even the limiting case — a perfect, instantaneous, noiseless temperature — leaves 17 Pa of the original 142 on the table, because one linear coefficient does not describe a one-second transient exactly. Meanwhile lifting the device forty centimetres off the desk is worth 5 Pa. The artefact outweighs the signal by three to one at the theoretical best.
Which settles what the compensation is. It is not a fix. It is a way to keep using a part that should be replaced, for the slow drift it was designed to catch.
The bargain does not improve on a better sensor
There is a tempting conclusion at this point. This sensor is extraordinary; on a normal unit — three pascals per kelvin rather than four hundred and seventy — the same correction would surely be a clean win. Characterise each device after assembly, put its coefficient in flash, done.
It does not work, and the reason is the only general result in this article.
The correction multiplies the drift by k. It multiplies the thermometer’s own noise by k as well. So compare the two ways the device can be wrong about a rate of climb:
uncompensated, false vario   ∝  k · (dT/dt)
compensated, noise in vario  ∝  k · σ_T / τ
where σ_T is the noise on a single temperature reading and τ is the vario filter’s time constant.
The ratio of those is (dT/dt · τ) / σ_T, and k has cancelled. Whether the correction is worth
applying does not depend on how bad the sensor is.
Put the numbers in. τ is about a second, σ_T is 0.03 K. The correction only starts winning once the device’s temperature is changing faster than 0.03 K per second, and in flight it changes at 0.01 to 0.05. The whole question sits on the boundary.
Averaging cannot rescue it either, and here the cancellation bites a second time. Averaging removes the noise by discarding precisely the band a variometer is made of. The only temperature changes a vario can see are the fast ones, and the fast ones are the ones you are forbidden to filter.
So: per-unit thermal compensation improves the altimeter and never improves the variometer. Not on this sensor, and not on a good one. Applied to the healthy sibling it would take that 62-centimetre artefact down to a few centimetres and add about a quarter of a centimetre per second of vario noise — the identical bargain, struck at a scale where nobody would ever notice either side of it.
What shipped, and what did not
The compensation did not ship. It worked, it does what every table above says it does, and it went in the bin.
That follows from the section before it. A SunVario is a variometer first — the altitude number matters, but nobody buys one to log a pressure trace. A feature that improves the altimeter and provably cannot improve the vario, in exchange for a per-unit calibration step at assembly and three device settings that need explaining, is not worth carrying. And on a unit damaged badly enough for it to matter, the honest repair is a new sensor.
What did ship is the instrument. Behind a build option that is off in every production image, the firmware streams raw sensor counts over Bluetooth: the 24-bit pressure and temperature registers before any filtering, sixty-two samples a second, with the calibration coefficients on request. That, plus a Python model reproducing the firmware’s arithmetic bit for bit, is why every sweep in this article ran on a laptop against a single recording with the device flashed once.
The heater shipped with it — a thread at the lowest priority that busy-waits on demand, lifting the
board a few degrees so P(T) can be traced without a thermal chamber and without a hand anywhere
near the device. A few milliamps while it runs, compiled out otherwise. It is the piece I would not
have thought to build if the problem had been easier.
Characterising a unit is now: flash the debug image, one command, five minutes, read a slope in pascals per kelvin. Under ten is fine. Ten to fifty is worth knowing about. Four hundred and seventy means somebody put an iron next to it.
Where it stands
The unit is getting a new sensor. That was always the answer, two days of measurement did not change it, and the version of me who started this would have told you so on the first morning.
What changed is that the folklore now has numbers under it. “Don’t solder near the barometer, and don’t rework it three times” is sound advice I have been giving and following for years. “That sensor is doing four hundred and seventy pascals per kelvin, its neighbour off the same reel is doing three, and no amount of software closes that gap for a variometer” is a different kind of statement. It says the damage is not a mild degradation you can dial out. It is a factor of a hundred and fifty, and it lands squarely on the one measurement the device exists to make.
It also points at where the fix actually lives, which is not in firmware. It is in not putting an iron there: relief in the board around the sensor, distance from mounting holes and connectors, one reflow instead of three. Those lower the coefficient on every unit at once. Compensation lowers it on one unit, in the wrong direction, for the wrong output.
What the exercise was actually worth is the method. The debug channel, the bit-exact model and the firmware heater turn a hardware question into an offline sweep, and they will be there for the next sensor and the next defect. So will the lesson attached to them: the bench answered every question I asked it, correctly, and the one that mattered was the one I did not think to ask until somebody picked the device up.
For the curious: it is not a correction, it is one wrong coefficient
The clearest way to see what the compensation does is to fold it back into the datasheet’s own formula. Pressure comes out of a polynomial in the scaled raw counts:
P_sc = P_raw / kP          T_sc = T_raw / kT

P = c00
  + P_sc·(c10 + P_sc·(c20 + P_sc·c30))
  + T_sc·c01
  + T_sc·P_sc·(c11 + P_sc·c21)

T[°C] = c0/2 + c1·T_sc
Subtract k·(T − T_ref) from that, substitute the temperature back in, and it rearranges into the
very same polynomial with two coefficients changed and nothing else added:
c01' = c01 − k·c1
c00' = c00 − k·(c0/2 − T_ref)
with k in pascals per kelvin. So there is no correction bolted onto the outside. There is one
factory coefficient that is wrong, and a reference point folded into another. On this chip the
factory wrote c01 = −1287, which works out to a temperature sensitivity of 5.3 Pa/K at this
altitude. Reality after the soldering iron demands c01 = +129813 — a hundred times larger, with
the sign flipped.
It also shows exactly where T_ref lives: in the constant term and nowhere else. Choose it badly
and every altitude shifts by a fixed amount while the vario never notices, because a constant does
not survive differentiation. Which is one more way of saying what this whole article says twice
over: the reference point is the altimeter’s problem, the noise is the variometer’s, and the two
never meet.