With a new soaring season around the corner, I wanted an automatic reminder about upcoming good flying days. The answer was right there: the API of the popular AI-based forecasting site Paraglidable. All it needed was a convenient wrapper. A couple of evenings later, @CanFlyBot was live.
Forecast coverage
The bot currently covers a defined region. If enough people use it, coverage can be extended. Keep in mind this is a forecast built on the GFS global model — a very, very rough estimate, but a good enough trigger to dig into a more detailed forecast. Data is refreshed daily at 08:00 UTC; the underlying forecast runs every six hours (03, 09, 15, 21 UTC).
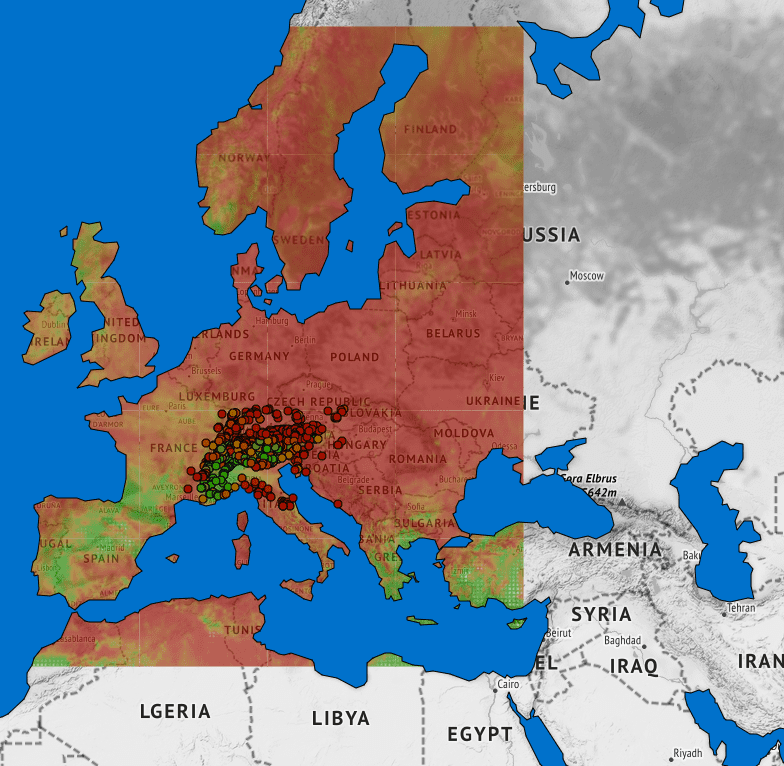 Paraglidable forecast coverage region.
Setup
After a recent update, @CanFlyBot can configure your own list of tracked points. To just try it out, follow this link and the bot will copy my list of points. To manage your own list, use /managespots.
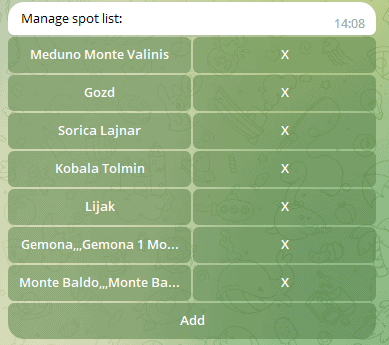 Editing the tracked-spots list via
 /managespots (Russian UI).
Cross icons delete points, Add adds new ones. There are four ways to add a point:
- Close to me. Share your location; the bot returns the 15 nearest take-offs and landings.
- By coordinate. Send
latitude;longitudein decimal degrees; the bot returns the nearest sites. - By name. Send part of a site name; the bot returns matches.
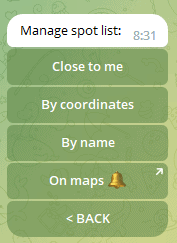
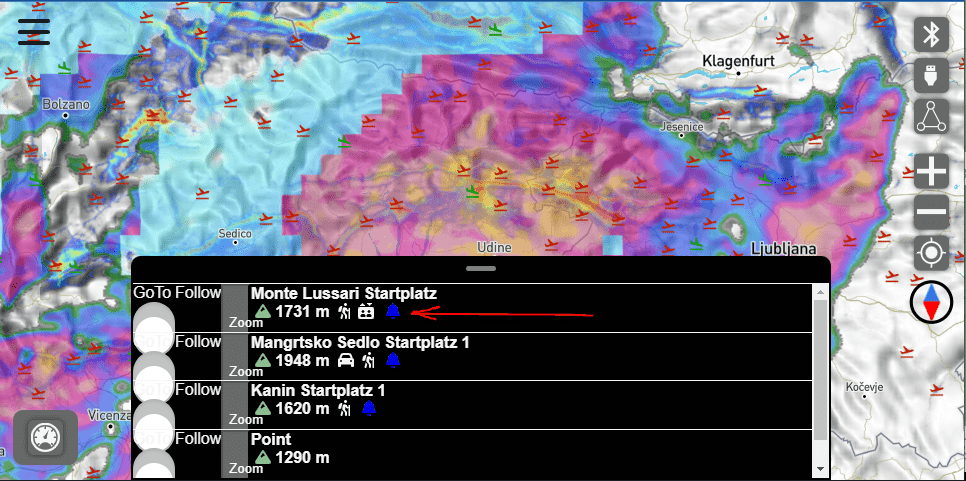
- On maps. Open maps.flybeeper.com, find the site, long-press it, click the bell icon, you are taken back to Telegram, then press Start.
 Adding a spot by latitude/longitude (Russian UI).
 Adding a spot by name (Russian UI).
The site database currently holds over 10,000 take-offs and landings. I recommend adding landings rather than take-offs. For a GFS forecast it does not matter, but landings are usually on the side of the ridge where the working thermal source sits, so the detailed forecast there will give better altitude data and a more realistic boundary-layer profile. You can add both and see which works better.
Day-to-day use
The main command, /canfly, requests a 10-day forecast and filters by the fly probability. The numbers in parentheses are, in order: fly — overall flying probability; xc — probability of completing a good XC route; wind — favourable wind; humidity — favourable clouds. Higher is better.
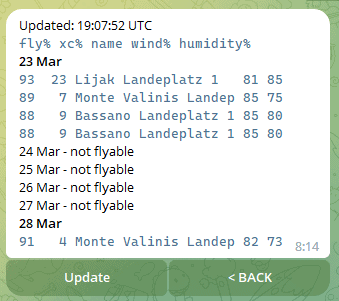 10-day flying forecast filtered by the
 fly probability (Russian UI).
Filter thresholds are configurable through /settings. There you also set the hour at which the bot pings you if probabilities exceed your thresholds — default /setremindathour 8 (08:00 UTC). You can also limit how many days ahead are analysed, to focus on the near term — default /setreminddaysbefore 2. Notifications can be temporarily silenced with /setriminderoff.
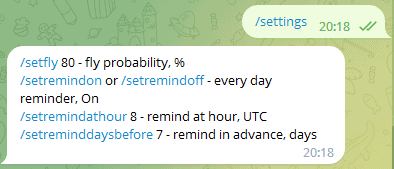 Filter thresholds and reminder hour in
 /settings (Russian UI).
/share generates a link that lets your friends start their own bot session pre-populated with your tracked spots. The list is copied at the moment of sharing, so they can modify it freely afterwards.
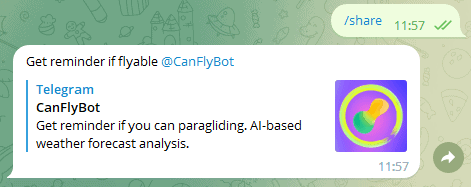 Sharing your tracked spots with friends (Russian UI).
If you find this useful, /donate is the way to say thanks.
 Tipping flow inside the bot (Russian UI).
Thermal forecast
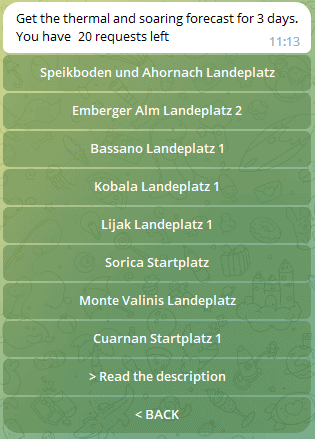
For each spot you can request a detailed 3-day thermal-forecast diagram via /getthermal.
 Meteoblue 3-day thermal diagram delivered through
 /getthermal.
Since Paraglidable’s AI analyses a relatively coarse GFS model, its notification is best treated as a trigger to look at a more detailed forecast. In my opinion, Meteoblue’s Thermal Forecast service is ideal for that. It runs on a much finer model, corrected with nearby weather-station data, morning soundings and terrain adaptation — a proper mountain forecast. But it is paid: my API key only covers 20 requests per day. That key is used on flybeeper.com/wh to analyse conditions at my home spot Kobala with daily updates. The minimum key price is €73/month. So @CanFlyBot offers each user 10 free queries on me. The diagram is regenerated once a day at 08:00 UTC. There is no point in requesting it more often.
A detailed description of the diagram is available in English, or directly from the bot via /getthermaldescription (or the >Read the description button near the bottom of the list).
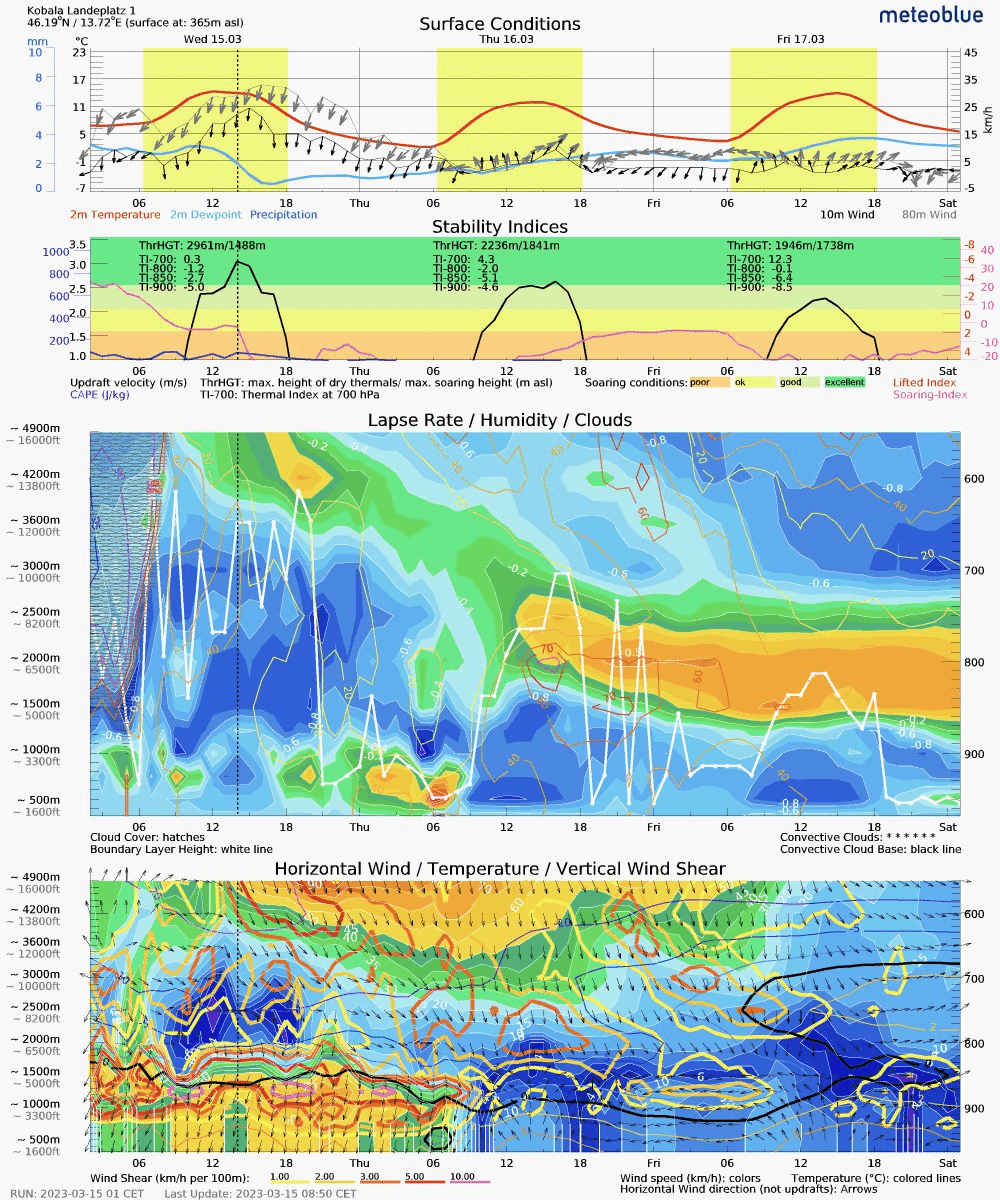 Diagram legend served by
 /getthermaldescription (Russian UI).
The short version: there are four sections. The biggest, in the middle, is the most important. Blue regions are zones of good lapse rate; green and yellow regions mark inversions. Wide blue zones make for good thermal flying. Bold black lines with stars are cloud base. The bold white line is the theoretical glider ceiling, accounting for wind-driven thermal break-up. The bottom section is wind: blue regions are good, green-yellow are not, bold coloured lines are turbulence zones. The second section from the top shows indices, colour-coded — any index on a green background is excellent; high values across any of them point to strong, possibly stormy weather. The top section shows general surface conditions. A wide gap between the blue and red lines means low humidity and high cloud base; a narrow gap means more cloud. Recent precipitation (blue bars) indicates wet ground that takes longer to heat. A big difference in wind speed at 2 m and 80 m points to tricky landing conditions and thermal break-up into bubbles.
If you find the diagram valuable, please cover my costs. Once you exhaust your free queries, @CanFlyBot offers a bundle of 50 queries for €5. Donations via /donate also add +50 queries.
Roadmap
I have been wanting to deploy my own forecast server for a long time — it would let me serve forecast tiles on maps.flybeeper.com and unify accounts between the site and the bot. It would also enable expanding the coverage area. Unfortunately the upstream open-source project has not been updated in four years and currently does not run. I tried hard to revive it: many patches in, I got training to start, but the GFS data model has apparently changed, and the forecast-download stage no longer works. It needs serious work on the Python source. I am not a big Python fan. Maybe later.